Liquid Real Assets are Built for These Times

The 2020s have been a turbulent few years in several respects, not least of which is revived and volatile inflation dynamics. In response to the new inflationary regime, institutional investors have been seeking to diversify into real assets. However, these efforts to hedge inflation have been confounded by a lack of liquidity in private markets. We believe the dual challenges of inflation and illiquidity can potentially be overcome with a sleeve of liquid real assets, which can potentially offer diversified exposure combined with attractive returns.
The inflationary backdrop
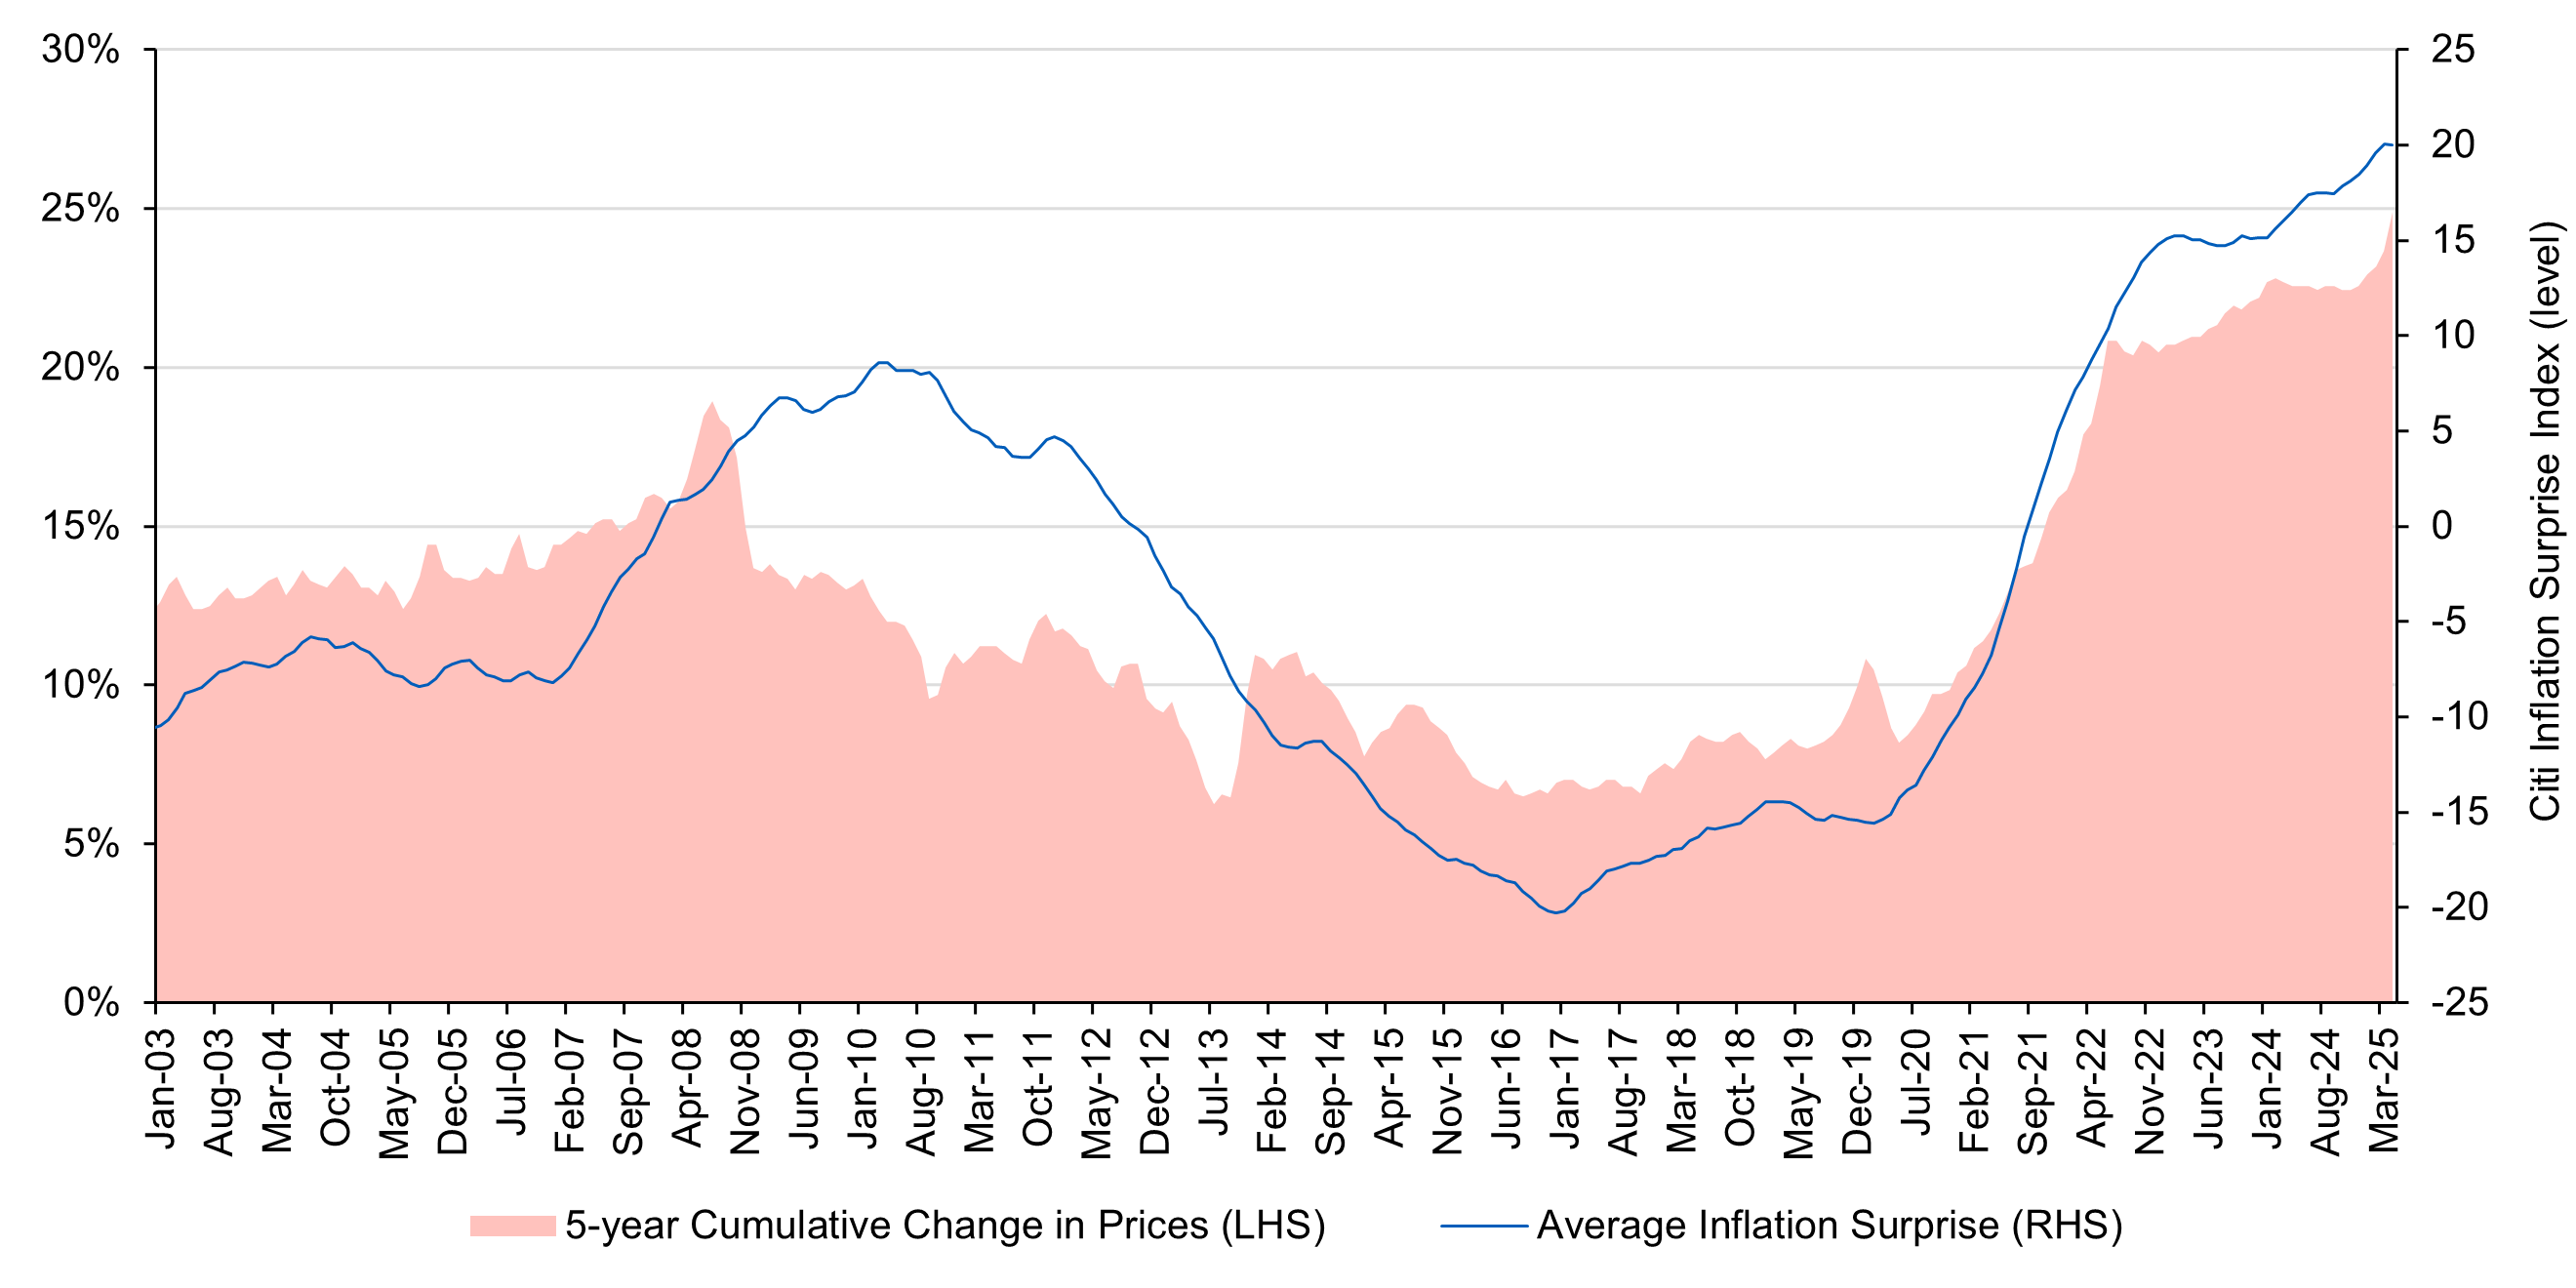
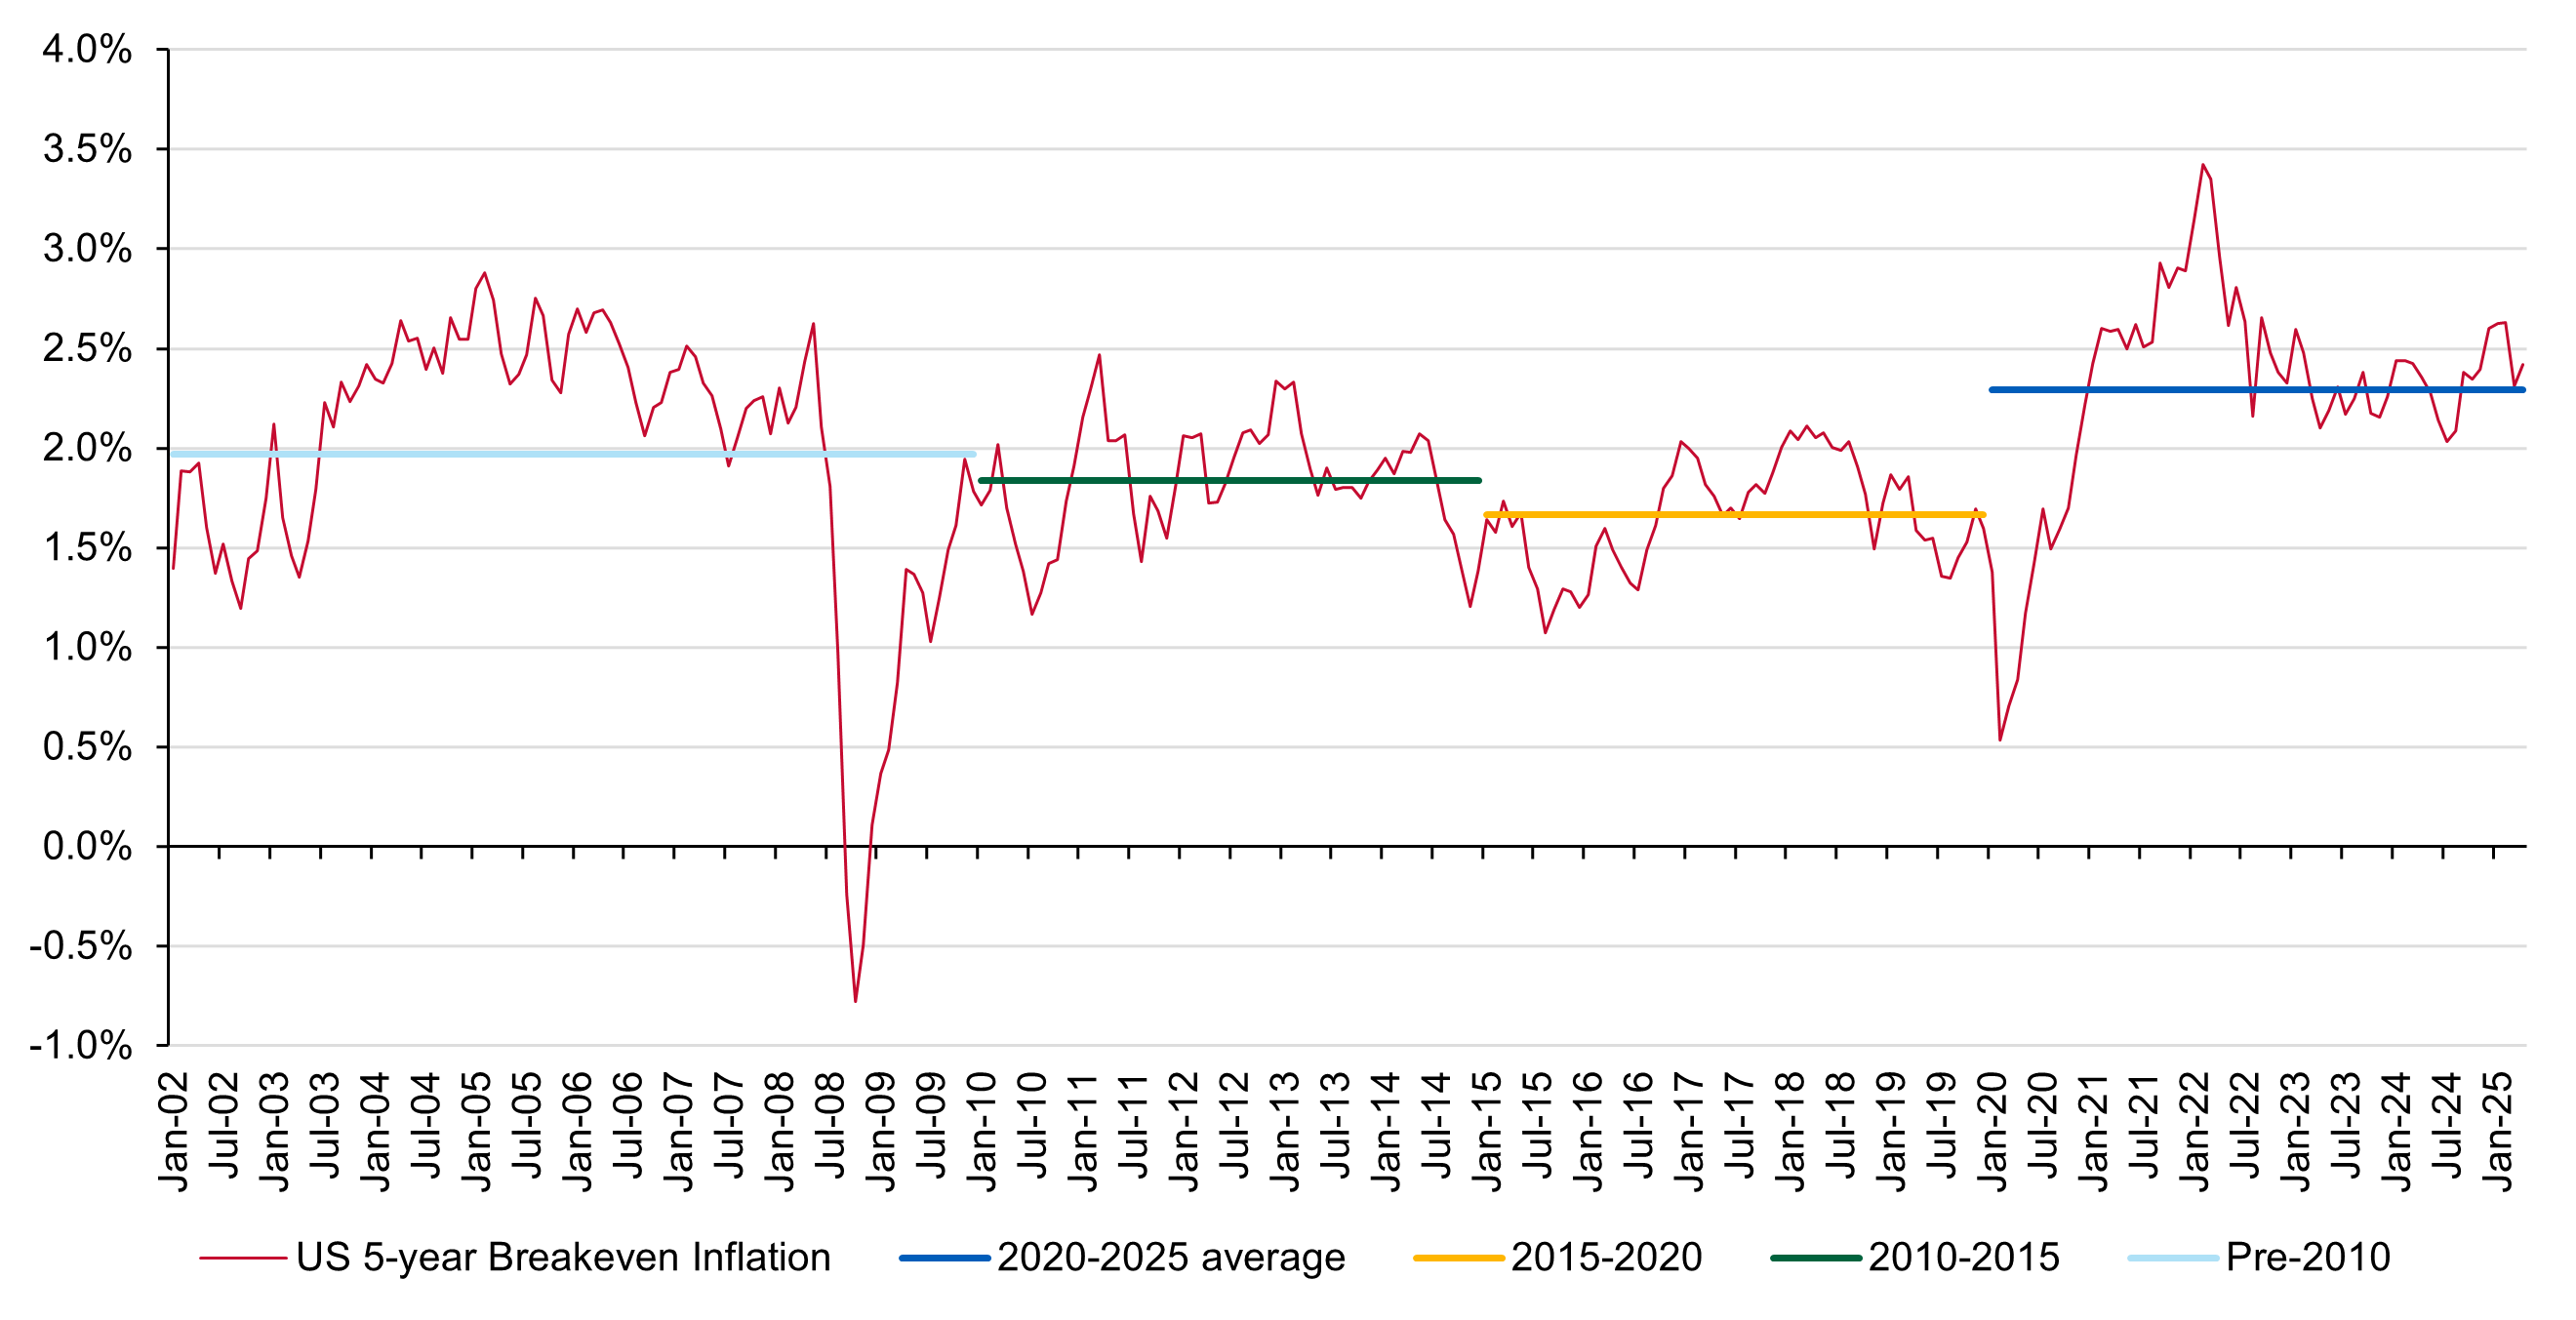
Prices have risen 25% this decade, which is significantly more than any rolling five-year period going back nearly 30 years. Not only are consumers struggling to adjust to this environment, but forecasters are, as well. Figure 1 shows that the average inflation surprise versus consensus forecast has been at all-time highs in recent years and is continuing to trend upward. Markets are also slowly adjusting. Figure 2 shows 5-year breakeven inflation averaging a higher level than in any prior period and generally pricing well above the Federal Reserve’s target.
Figure 1: Forecasters are struggling to adapt to the new inflationary regime
Average inflation surprise vs. 5-year cumulative change in prices (12/31/2002-4/30/2025)
Source: L&G – Asset Management, America. Bloomberg. Data as of April 30, 2025. The Citi Inflation Surprise Index measures price surprises relative to market expectations. See disclosures for additional information.
Figure 2: 5-year breakeven inflation average is at a high
5-year breakeven inflation and averages (12/31/2001-4/30/2025)
Source: L&G – Asset Management, America, Bloomberg. Data as of April 30, 2025.
Gradual (and sudden) portfolio implications
We eagerly borrow from Hemingway to describe the two ways that inflation can affect portfolios: gradually, then suddenly. So far, thankfully, the portfolio effects of inflation have mostly been gradual, with the increase in inflation slowing eroding the real value of portfolios. The only sudden reminders have come through the performance of 60/40 portfolios in 2022 and inflation fears embedded in the April 2025 tariff announcements. Investors’ response to the new inflationary regime has been even more gradual, though. In 2023, JPMorgan reported that institutional investors “have been focusing on real assets, such as infrastructure and commodities, as key hedges against inflation.” In 2024, Aon’s Global Pension Risk Survey similarly reported a significant increase in plans to allocate to infrastructure. But according to WTW, formerly known as Willis Towers Watson, at the end of 2024 investors typically held only 0-5% of their portfolio in real assets other than private real estate.
Public equity markets, on one hand, thankfully continue to grow portfolio values. On the other hand, that strong performance may be lulling investors away from the calls to action highlighted by the surveys mentioned above. Meanwhile, the disinflationary trends of 2024 have dissipated, and consensus inflation expectations are again on the rise. If the trend persists, strong returns are likely untenable for equities and certainly for fixed rate nominal bonds.
Another common challenge currently facing investors may also be confounding efforts to diversify into real assets. The lack of liquidity, primarily due to challenges in the private equity market, is making it difficult for institutions to rebalance their portfolios, including into real assets. Moreover, much of the interest in infrastructure and real estate seems to be through private markets, which would only compound investors’ illiquidity issues.
Liquid real assets rise to the challenge
One approach to address these challenges would be to create a sleeve of liquid real assets. In addition to the performance and diversification characteristics detailed below, this has several practical advantages. Listed infrastructure, real estate investment trusts (REITs) and commodities are all very deep, liquid markets. Exposure can be gained quickly and cheaply, particularly if an investor desires to rebalance away from public equity to fund the exposure. Utilizing a single allocation with one manager may also mitigate other liquidity and rebalancing challenges. Liquid real assets are complementary to one another (e.g., commodities can be collateralized with TIPS to provide further inflation protection with greater capital efficiency) and to private real assets.
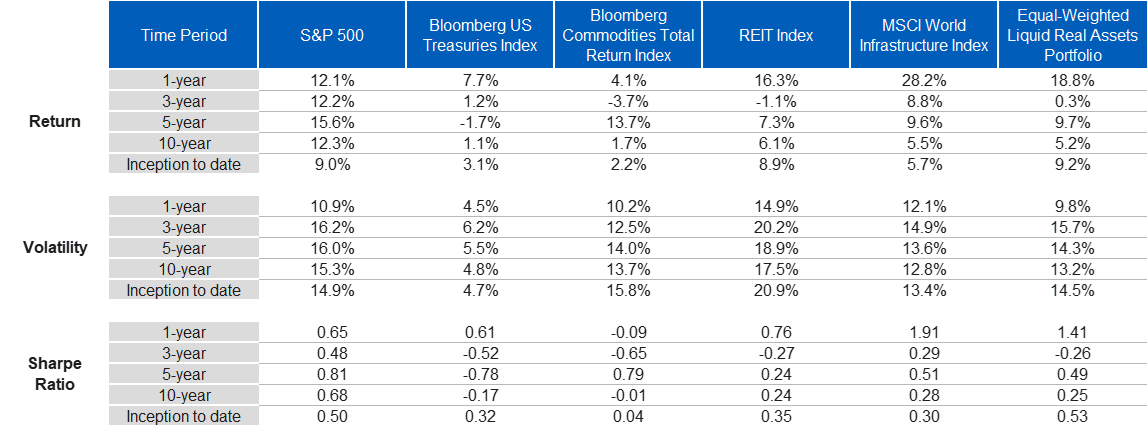
Figure 3 assumes an equal-weighted liquid real assets portfolio, but the allocations could be managed dynamically to address illiquidity in other parts of the portfolio or to create a completion portfolio around other private real assets. Even this simplistic combination of liquid real assets potentially delivers powerful diversification benefits, though. And the whole can be greater than the sum of its parts, especially when some parts – namely commodities – have been shunned for a long period due to lower absolute returns. The performance summaries in Figure 3 are not only noteworthy at the headline level but also offer deeper insights that are critically important to allocators considering portfolio allocation changes in response to the current market regime.
Figure 3: An equal-weighted liquid real assets portfolio can offer diversification benefits
Returns, volatilities and Sharpe Ratios across time (12/31/2001-4/30/2025)
Source: L&G – Asset Management, America, Bloomberg. Data as of April 30, 2025. See disclosures for full index representations and components of the equal-weighted liquid real assets portfolio.
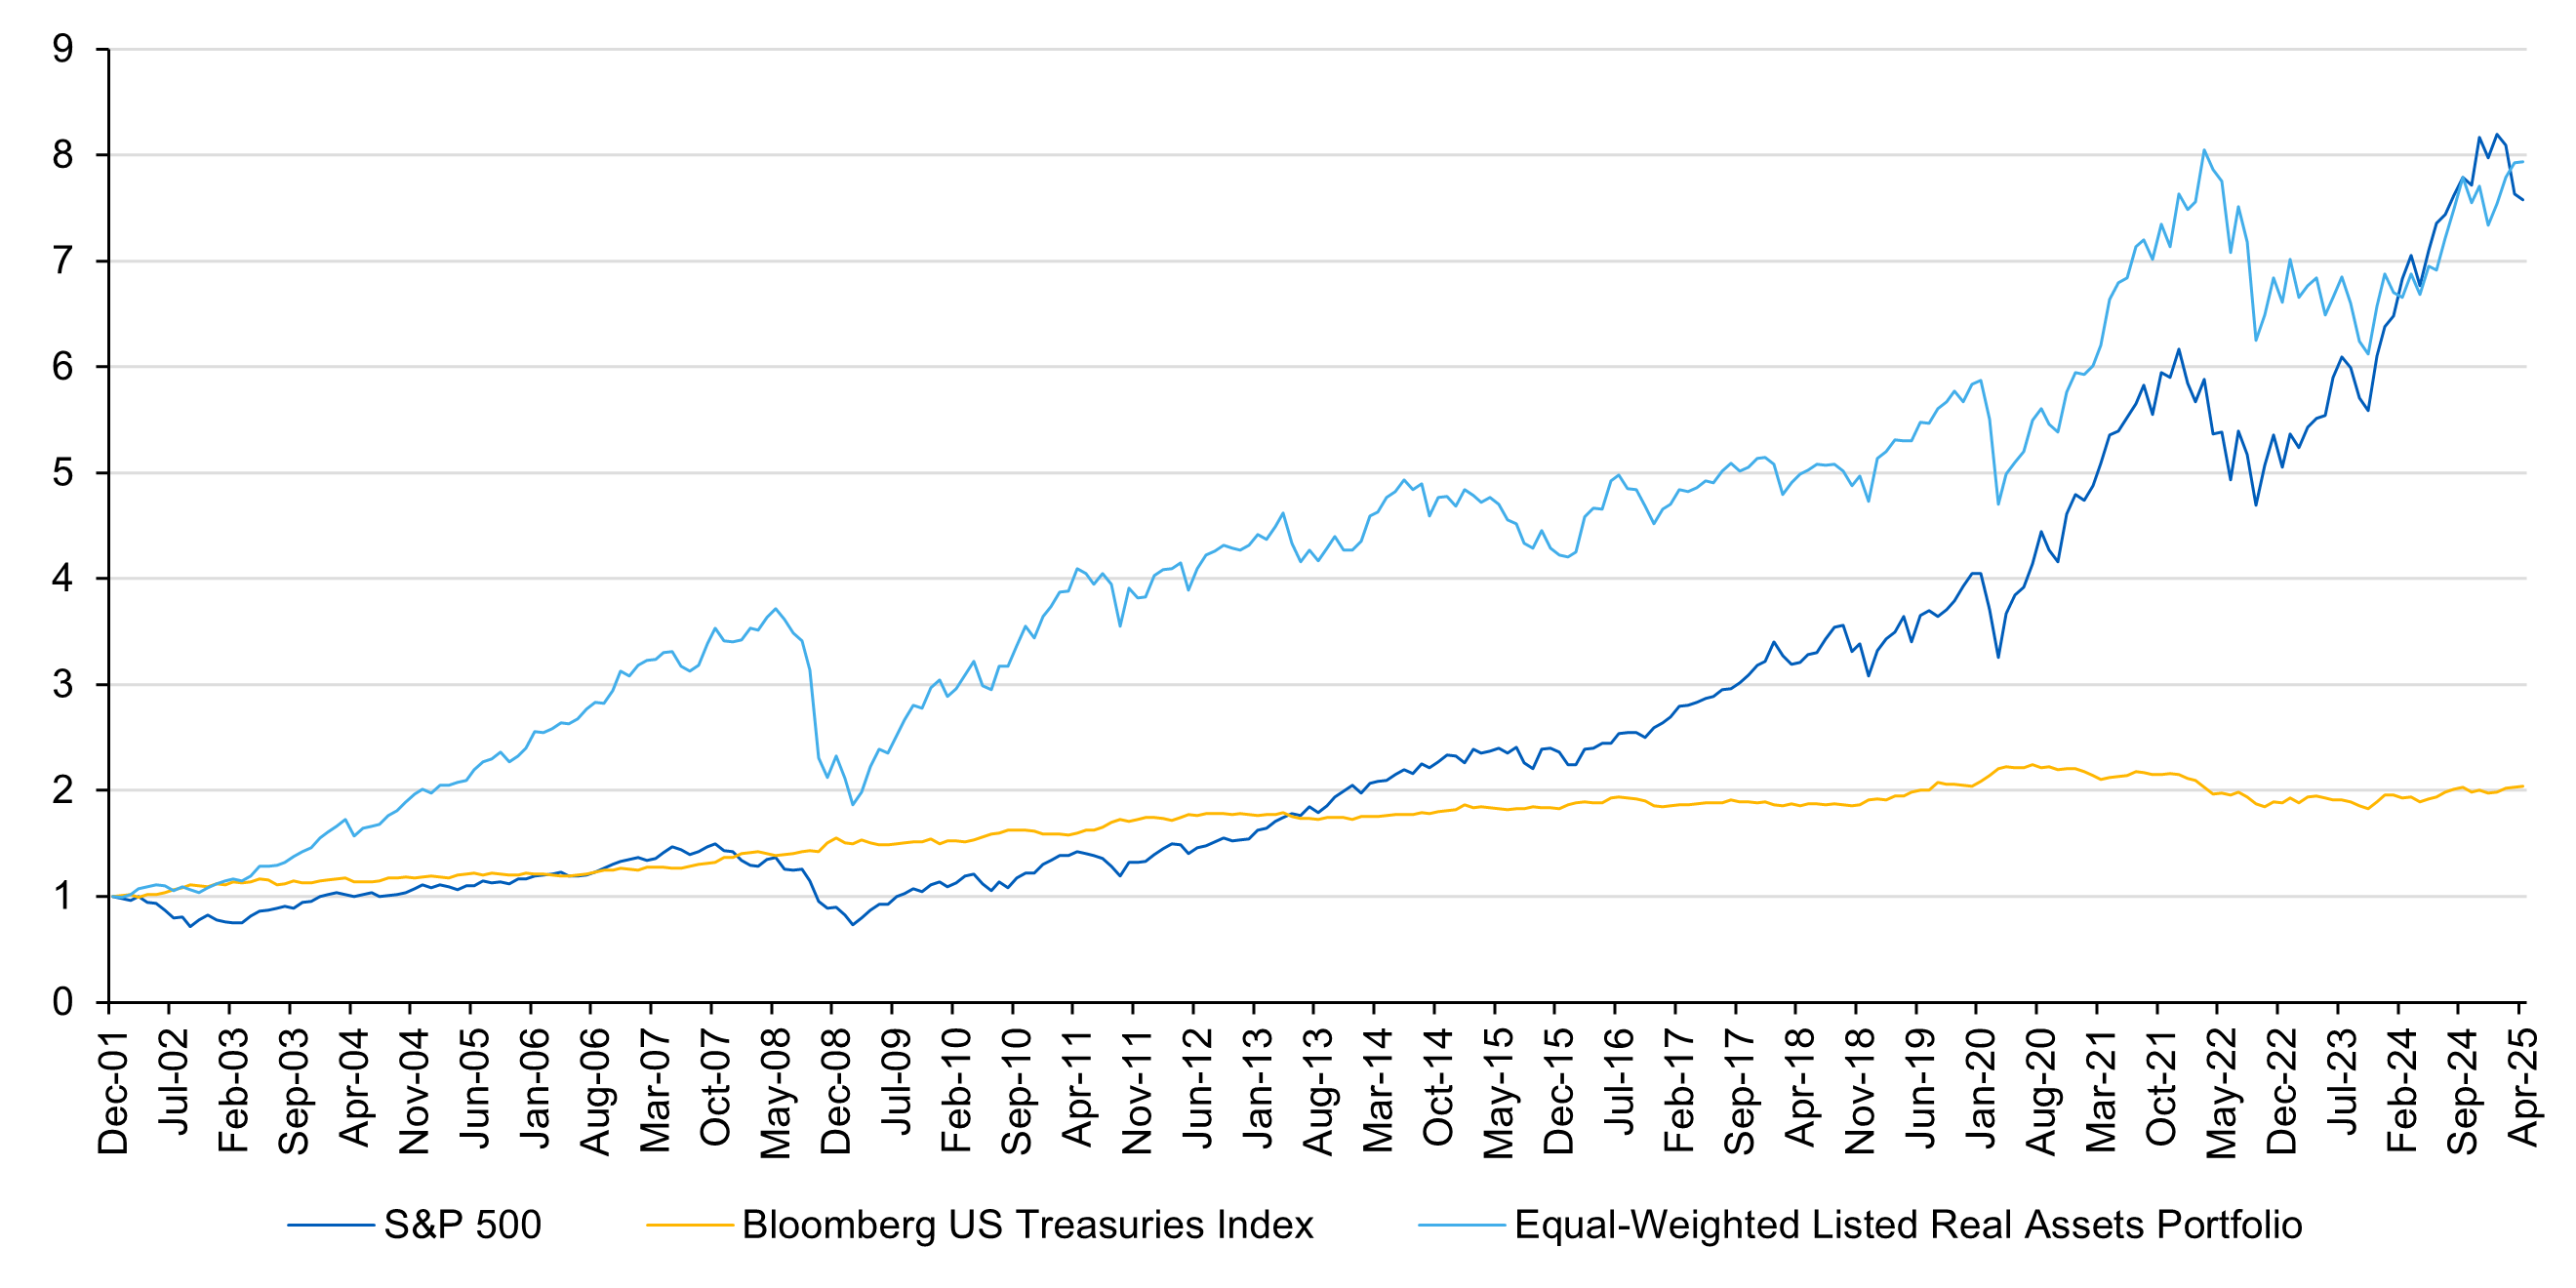
No component of a liquid real assets portfolio strictly dominates the others across any performance or time dimensions. Nor does the liquid real assets portfolio always outperform any other traditional beta across all metrics or time periods. But Figure 4 demonstrates that over the long horizon, investors are not sacrificing returns relative to the exalted US large cap equity exposure anywhere close to as much as common perceptions would have us believe.
Figure 4: A liquid real assets portfolio can offer attractive relative returns
Cumulative returns by asset class (12/31/2001-4/30/2025)
Source: L&G – Asset Management, America, Bloomberg, Data as of April 30, 2025.See disclosures for full index representations and components of the equal-weighted liquid real assets portfolio.
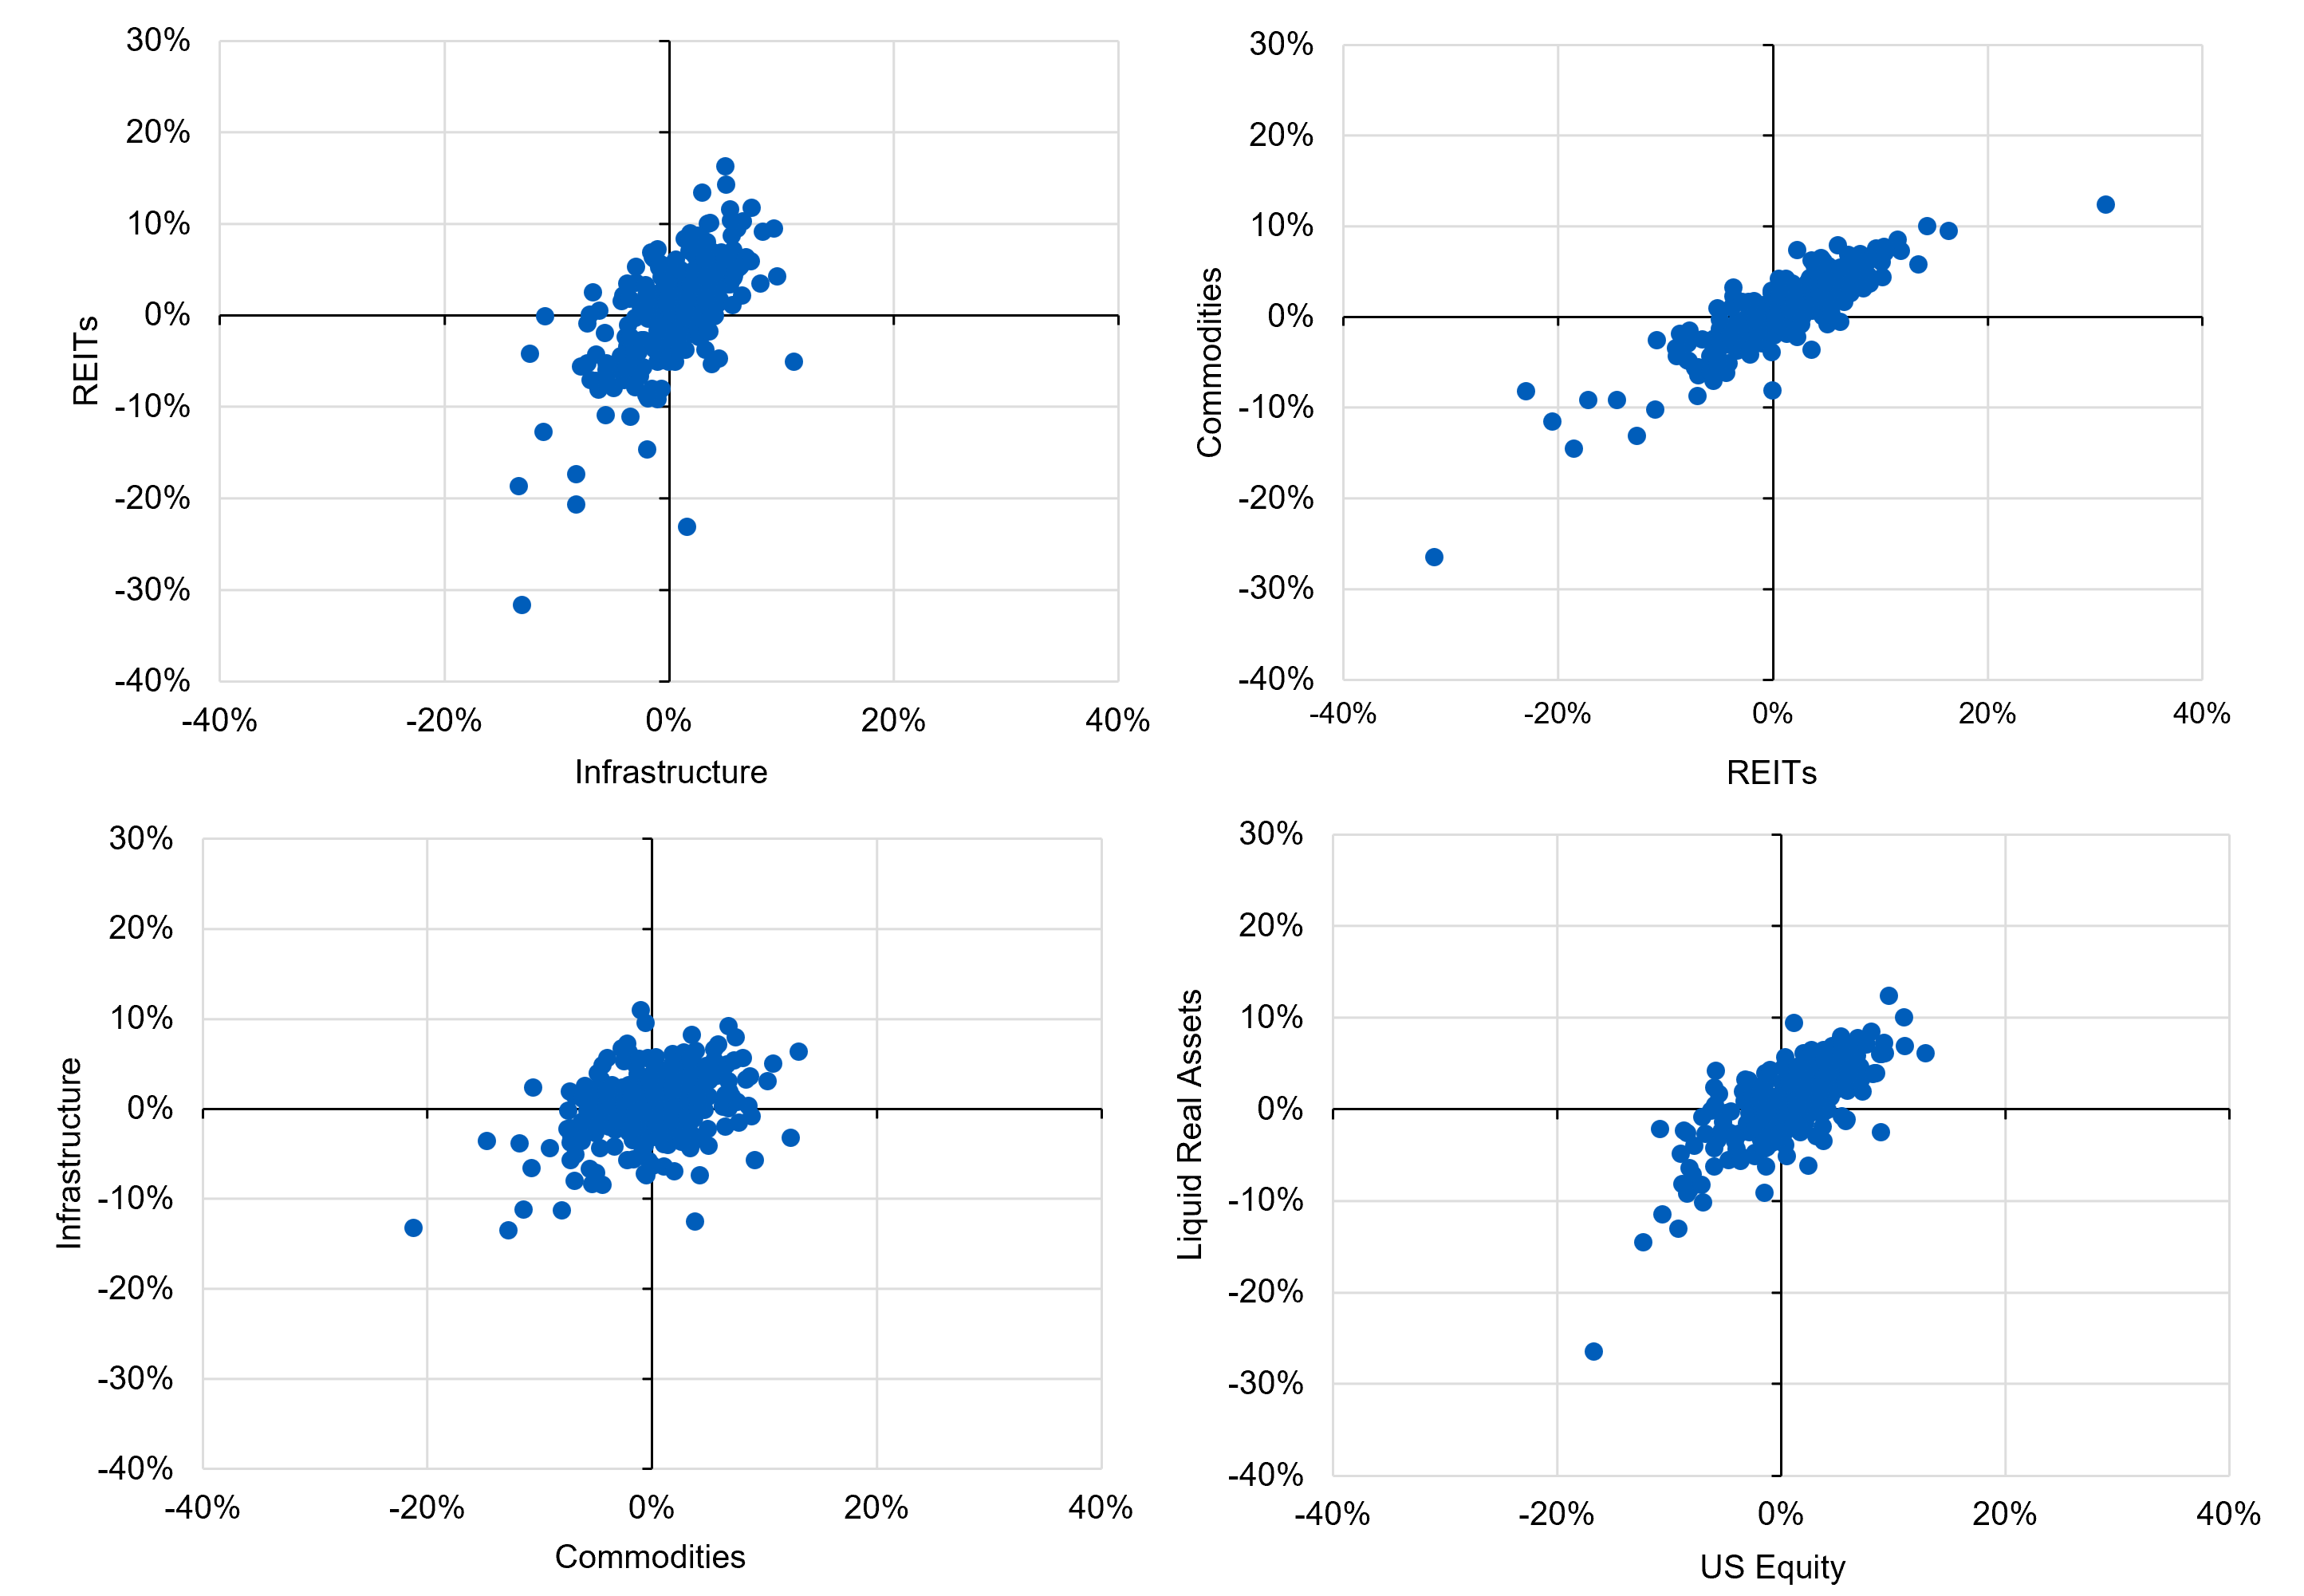
We are not suggesting liquid real assets simply for the sake of portfolio growth, though. We see these results as a testament to the power of diversification. Not only does any one component of a simple liquid real assets portfolio diversify a 60/40 portfolio, but the components also diversify each other, making a much greater impact on portfolio resiliency as a whole than as individual parts. Bundling the components offers simple, transparent exposure to a category of assets that respond differently to the vagaries of macro, policy and geopolitical risks.
Figure 5: Liquid real assets respond differently to macro, policy and geopolitical risks
Pairwise correlations (12/31/2001-4/30/2025)
Source: L&G – Asset Management, America, Bloomberg. Data as of April 30, 2025. See disclosures for full index representations and components of the equal-weighted liquid real assets portfolio.
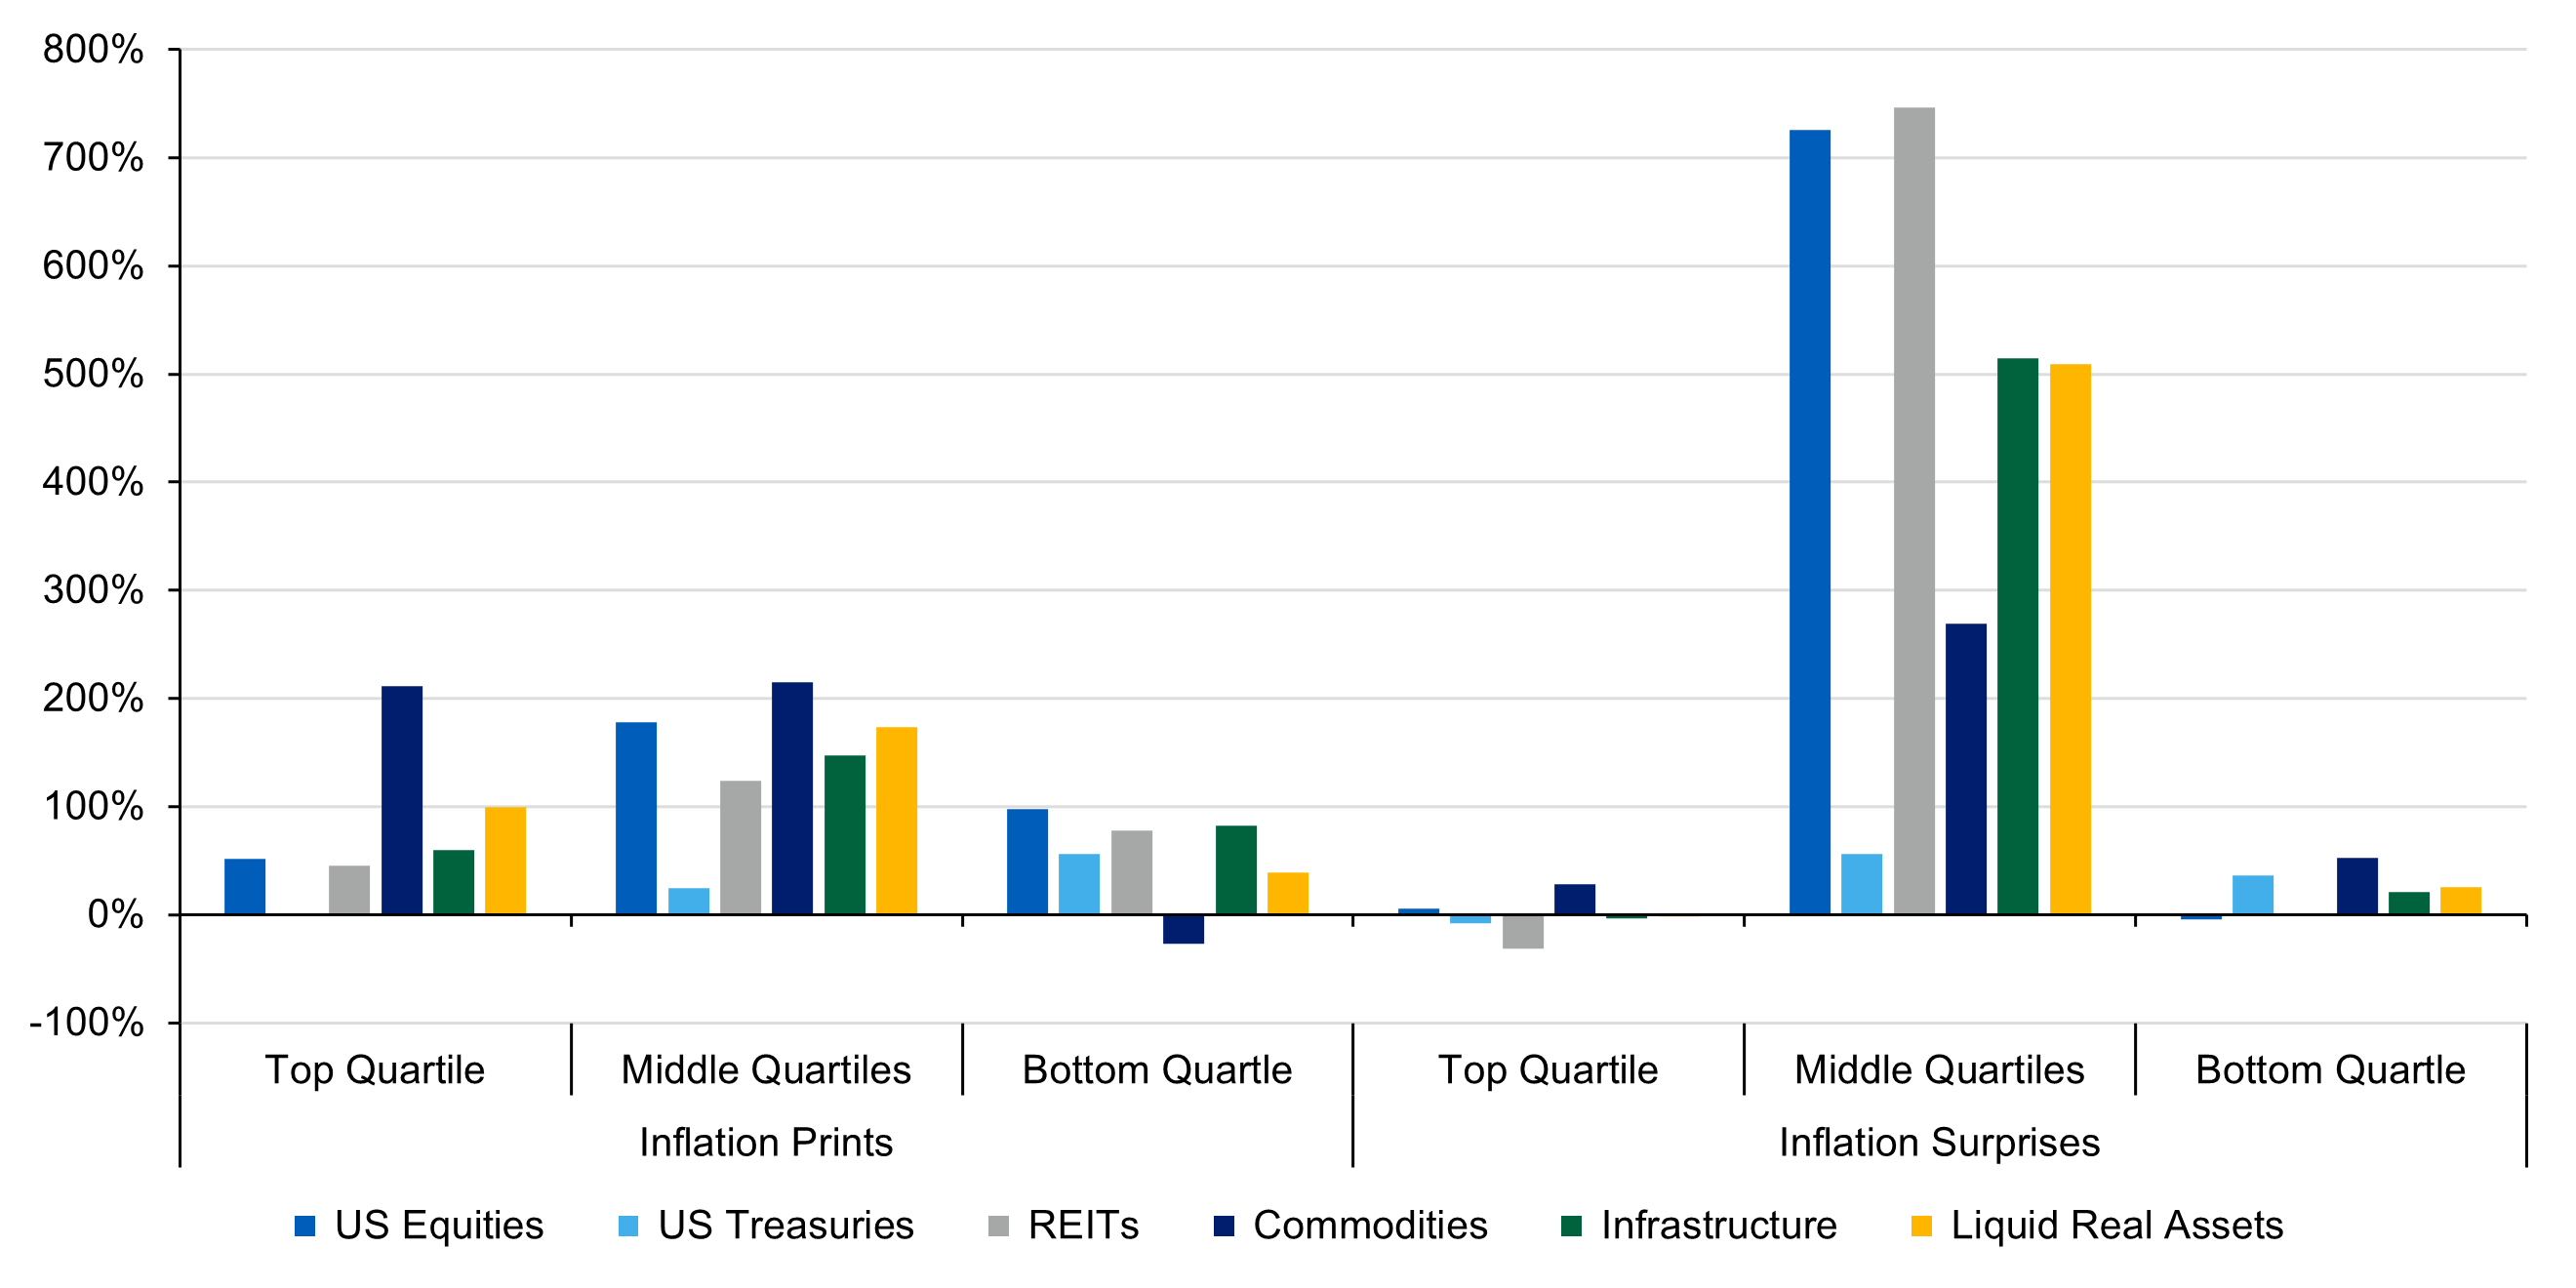
Finally, those varying sensitivities to unique risks are what enable a liquid real assets portfolio to provide investors with better inflation protection in addition to strong risk-adjusted returns. Commodity investments are linked to materials that are in increasing demand in the here-and-now, driving up spot prices. Both infrastructure and real estate are linked to policy priorities driving fresh investment, and the income component of their returns are linked to cash flows that regularly reset in response to broad inflationary pressures. Figure 6 details this performance, and Figure 7 helps visualize it. When inflation is uninspiring and unsurprising, all assets tend to do quite well. So, we ignore that and focus on the inflation tails. Remarkably, liquid real assets perform well when inflation has been particularly high and particularly low (and there is good rationale for this).
Figure 6: Liquid real assets may provide investors with better inflation protection and strong risk-adjusted returns
Cumulative changes by inflation environment (12/31/2001-4/30/2025)

Source: L&G – Asset Management, America, Bloomberg. Data as of April 30, 2025. See disclosures for full index representations and components of the equal-weighted liquid real assets portfolio.
Figure 7: Liquid real assets historically have performed well when inflation has been particularly high and low
Asset class cumulative returns (12/31/2001-4/30/2025)
Source: L&G – Asset Management, America, Bloomberg. Data as of April 30, 2025. See disclosures for full index representations and components of the equal-weighted liquid real assets portfolio.
Closing thoughts
In summary, we find that liquid real assets provide diversified exposure without a dramatic sacrifice of returns. Importantly, they also have historically achieved those results in inflationary environments where most other broad asset classes have struggled. In an environment where it seems increasingly likely that the dual challenges of inflation and illiquidity will persist, liquid real assets may prove to be a beneficial component of any investor’s portfolio.
Disclosures
The material in this presentation regarding L&G – Asset Management, America is confidential, intended solely for the person to whom it has been delivered and may not be reproduced or distributed. The material provided is for informational purposes only as a one-on-one presentation and is not intended as a solicitation to buy or sell any securities or other financial instruments or to provide any investment advice or service. Where applicable, offers or solicitations will be made only by means of the appropriate Fund’s confidential offering documents, including related subscription documents (collectively, the
Certain information contained in this document constitutes “forward-looking statements,” which can be identified by the use of forward-looking terminology such as “may,” “will,” “should,” “seek,” “expect,” “anticipate,” “target,” “project,” “estimate,” “intend,” “continue,” “believe,” the negatives thereof, other variations thereon or comparable terminology. Due to various risks and uncertainties, actual events or results or the actual performance of the Fund may differ materially from those reflected or contemplated in such forward-looking statements.
In certain strategies, L&G – Asset Management, America might utilize derivative securities which inherently include a higher risk than other investments strategies. Investors should consider these risks with the understanding that the strategy may not be successful and work in all market conditions.
Reference to an index does not imply that an L&G – Asset Management, America portfolio will achieve returns, volatility or other results similar to the index. You cannot invest directly in an index, therefore, the composition of a benchmark index may not reflect the manner in which an L&G – Asset Management, America portfolio is constructed in relation to expected or achieved returns, investment holdings, portfolio guidelines, restrictions, sectors, correlations, concentrations, volatility, or tracking error targets, all of which are subject to change over time.
No representation or warranty is made to the reasonableness of the assumptions made or that all assumptions used to construct the performance provided have been stated or fully considered.
These assumptions are theoretical and intended to provide a conceptual framework for understanding how certain investment strategies or models might operate under idealized conditions. These assumptions do not reflect actual market conditions or specific investor circumstances. Hypothetical scenarios may simplify complex market dynamics and investor behaviors. They may not fully capture the impact of variables such as market volatility, liquidity constraints, or transaction costs. The assumptions used may have inherent limitations and may not accurately represent future market conditions or investor experiences. They are designed for illustrative purposes only and should not be interpreted as predictive of actual performance or outcomes.
There is no guarantee that actual results will match the outcomes suggested by these hypothetical assumptions. Real-world investing involves risks and uncertainties that may differ from the assumptions made in these scenarios. Investors should carefully consider their own financial situation, risk tolerance, and investment goals before making decisions based on hypothetical assumptions. It is recommended to consult with a financial advisor to understand how these assumptions might apply to actual investment scenarios.
Certain information contained in these materials has been obtained from published and non-published sources prepared by third parties, which, in certain cases, have not been updated through the date hereof. While such information is believed to be reliable, L&G – Asset Management, America has not independently verified such information, nor does it assume any responsibility for the accuracy or completeness of such information. Except as otherwise indicated herein, the information, opinions and estimates provided in this presentation are based on matters and information as they exist as of the date these materials have been prepared and not as of any future date and will not be updated or otherwise revised to reflect information that is subsequently discovered or available, or for changes in circumstances occurring after the date hereof. L&G – Asset Management, America’s opinions and estimates constitute L&G – Asset Management, America’s judgment and should be regarded as indicative, preliminary and for illustrative purposes only.
The 5-year Cumulative Change in Prices is calculated as CPI(t+5)/CPI(t) using the Consumer Price Index for All Urban Consumers (CPI-U).
Indices used in our analysis:
- U.S. Equities/Equity: S&P 500 Total Return Index, SPTR Index
- US Treasuries: Bloomberg US Treasuries Total Return Index, LUATTRUU Index
- Commodities: Bloomberg Commodities Total Return Index (BCOM Total Return), BCOMTR Index (a standard, fully-collateralized commodity benchmark that assumes collateral is invested in U.S. Treasury Bills and is utilized by L&G – Asset Management, America as its commodities strategy benchmark)
- REITs or REIT Index: Dow Jones Equity REIT Total Return Index, REIT Index
- Infrastructure: MSCI World Infrastructure Net Total Return USD Index, M1WO0INF Index
- Liquid Real Assets:
- 33.3% REITs, as represented by the index above
- 33.3% Infrastructure, as represented by the index above
- 33.4% Commodities, as represented by 26.7% Bloomberg Commodity Roll Select Index, BCOMRS Index, and 6.7% of the Bloomberg Gold Sub-index, BCOMGC Index, which aligns with L&G – Asset Management, America’s commodities strategy as of the date of this document. As these are excess return versus total return indices, we have assumed they are fully collateralized by the Bloomberg US TIPS Total Return Index, LBUTTRUU Index, for the periods reflected and combined their returns with those of the LBUTTRUU Index.