A Managing Risk Roadmap for Balanced Portfolios

Diversification is supposed to be the only free lunch, but when historical relationships—like the traditionally inverse one between bond and stock prices—break down, public pensions must look at what else is on the menu. Below we provide a roadmap to help plans determine optimal approaches for drawdown mitigation.
We begin with broader historical context and simple, objective scenario analysis that can be instructive for setting expectations for US Treasuries as a diversifier or hedge for higher return-seeking assets and then we delve into the full menu available for managing risk.
A stocks-down, bonds-down environment
Recently, markets have had to contend with “Liberation Day,” poor Treasury auctions, renewed and multiple conflicts in the Middle East and the list goes on. Those events are occurring at a time when equities are priced nearly for perfection, and all markets are oscillating between inflation fears and growth worries. So, equities are more vulnerable to corrections and the response from Treasuries is less reliable, depending on which macroeconomic narrative is dominant at the time.
Case in point, 2025 is already—before the year is even half over—outpacing the average full year for the number of days when equities are down more than 1% and Treasury returns are also negative.1 Many investment professionals today have not experienced an environment persistently like this.
Setting expectations for US Treasuries
With yields today at 20-year highs, benchmark duration is lower. Figure 1 shows the well-known relationship between bond yields and duration. As yields move up, duration falls and vice versa. Starting duration is the largest determinant of fixed income returns, making portfolios less sensitive to yield changes today than in recent years. Higher starting yields ostensibly provide more room to fall (i.e., so that total returns are better, despite lower starting duration). However, Figure 2 shows that in today’s murky middle of the road duration/yield relationship, rates moving higher is just as likely. That coin flip on yields moving lower or higher is weighted between persistent inflationary pressure and slowing, late cycle growth.
Figure 1: As bond yields move up, duration falls and vice versa
US Treasury index yield and duration (1/31/90-5/30/25)
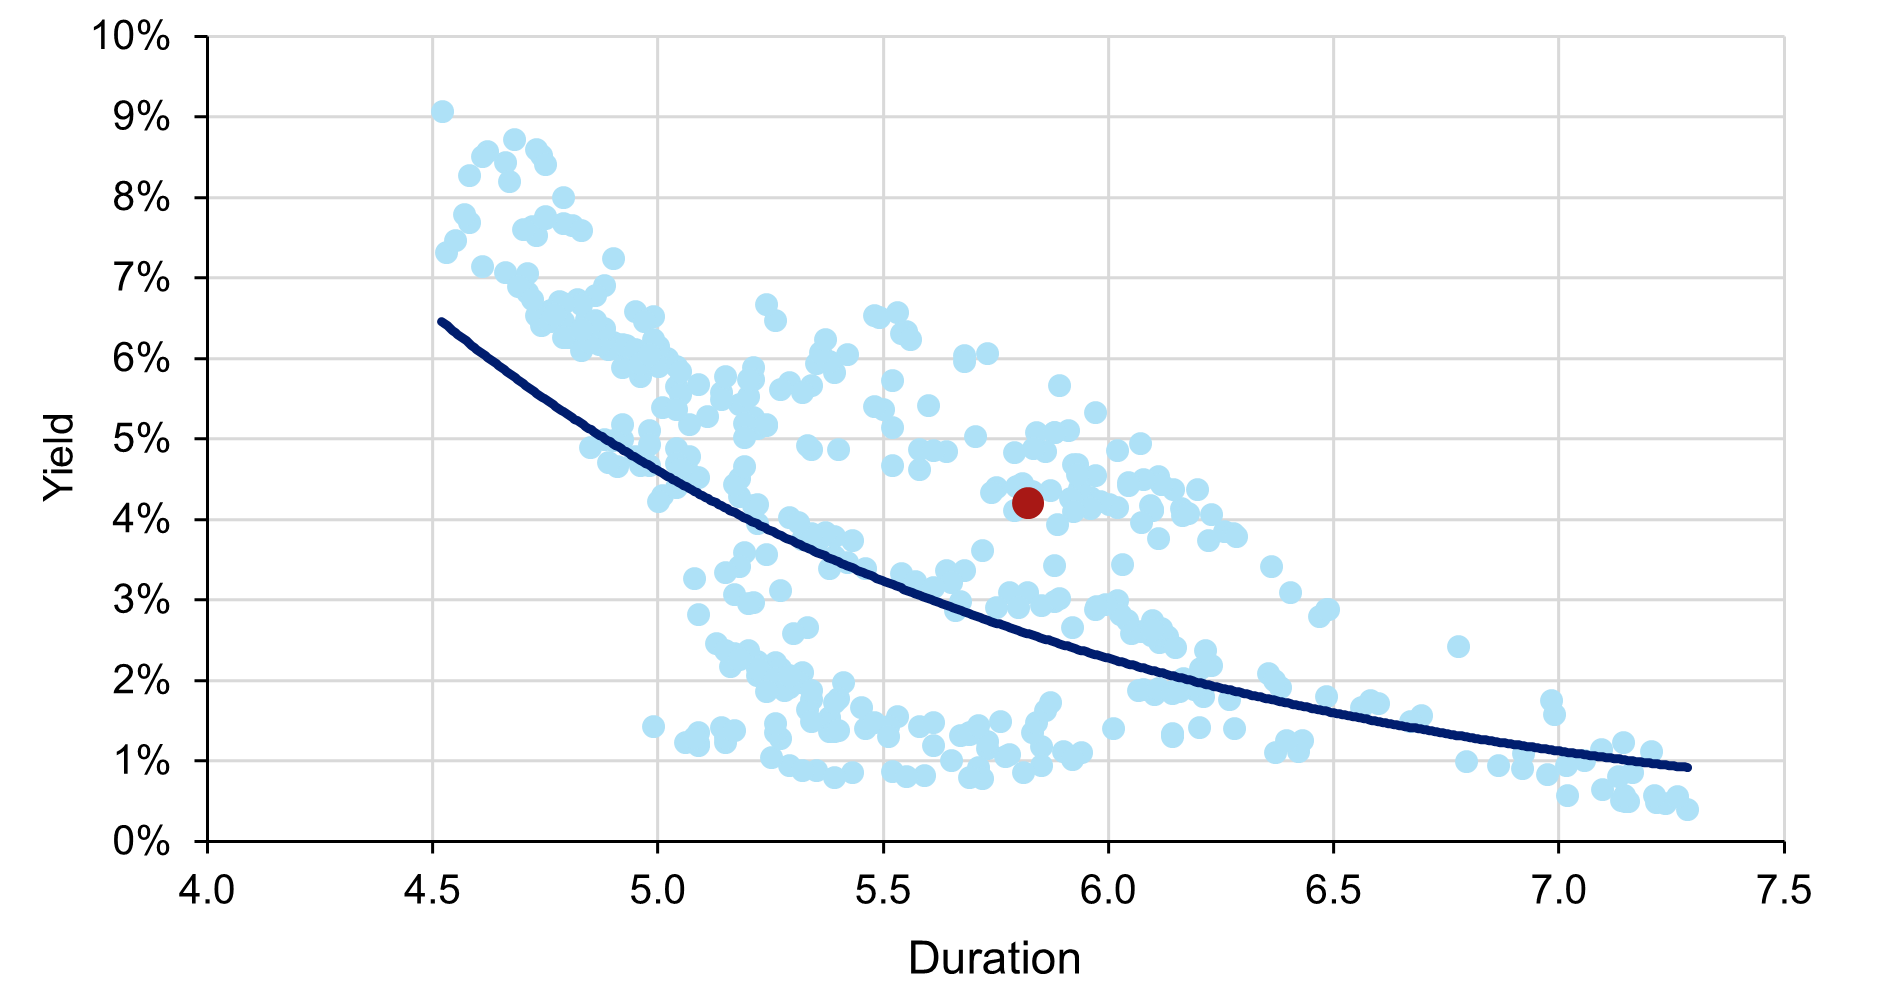
Source: L&G – Asset Management, America and Bloomberg. Data as of May 30, 2025. The red dot represents today.
Figure 2: Rates could move up or down from here
Distribution of monthly US Treasury index yield changes for a given starting duration (1/31/90-5/30/25)
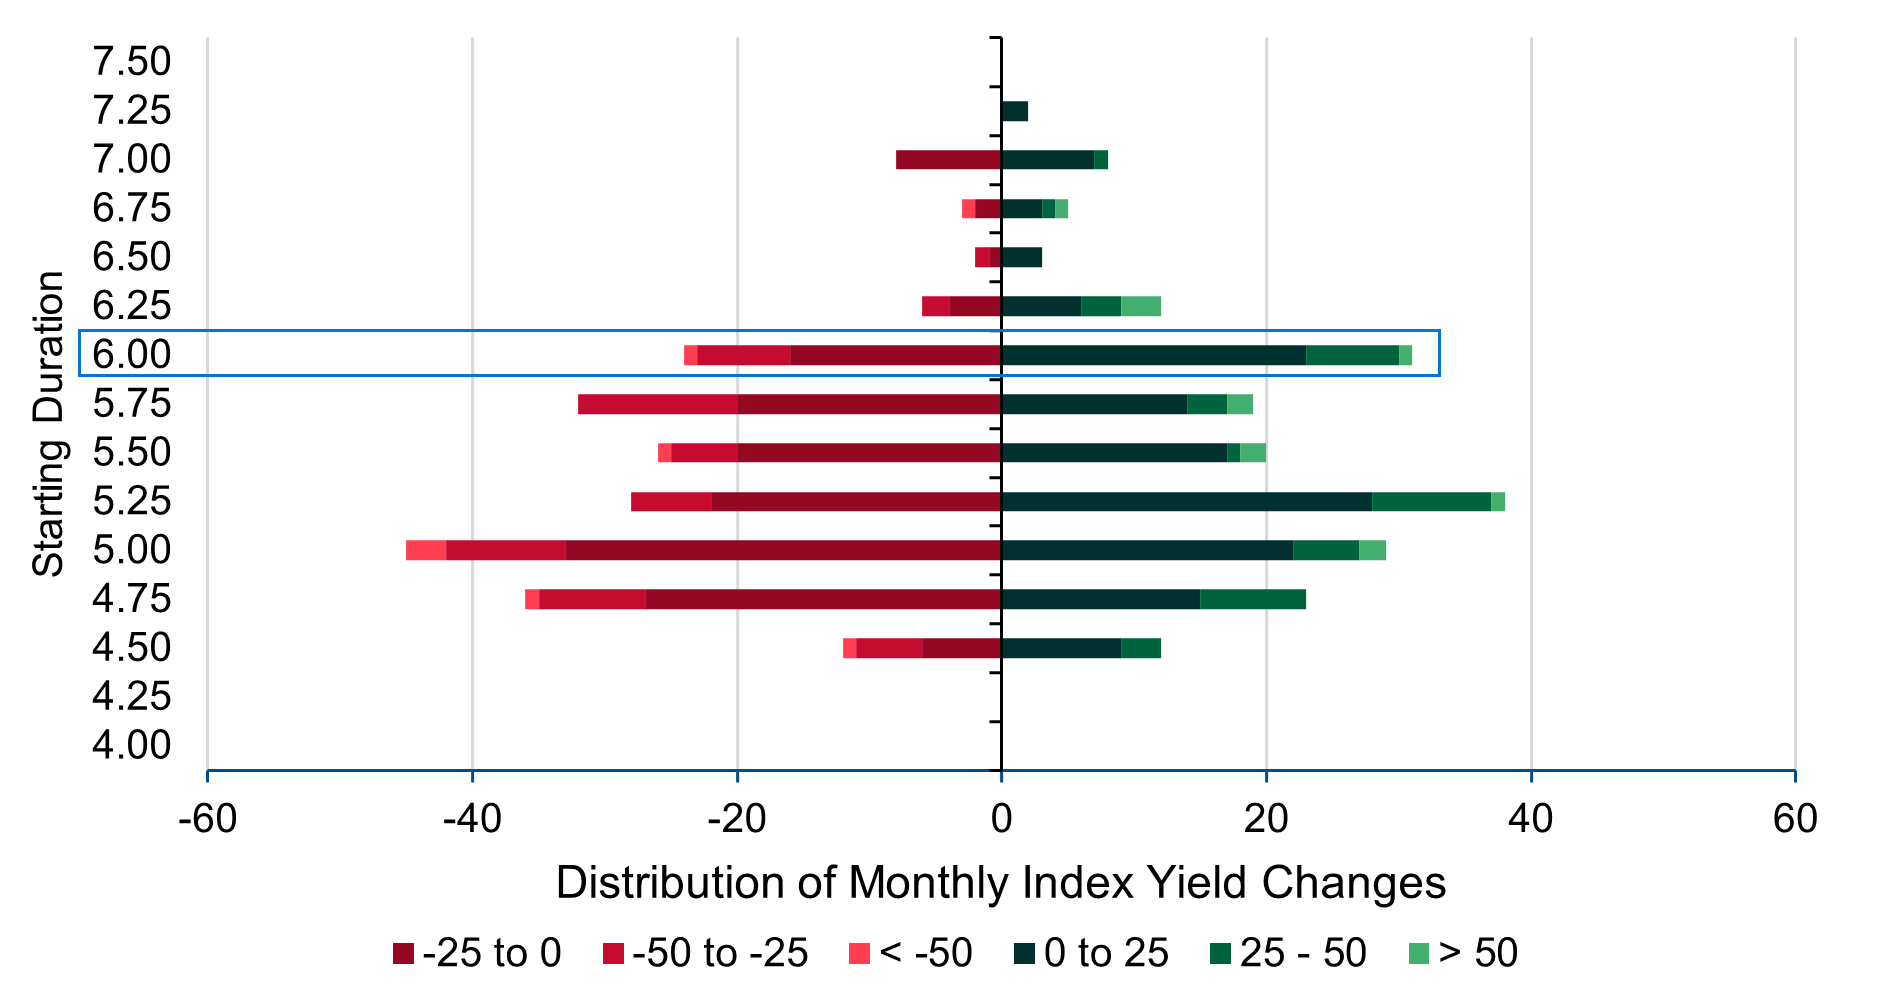
Source: L&G – Asset Management, America and Bloomberg. Data as of May 30, 2025. The outlined row represents today.
So, what potential protection do US Treasuries currently provide multi-asset investors? Unfortunately, not much. At today’s starting duration (approximately six years), a 50 basis point (bps) decline in yield nets a return of 3%. For an investor with a 70/30 portfolio, that offsets a scant -1.3% equity decline. Figure 3 presents this relationship under a wider set of scenarios. The critical observation is that realizing any material portfolio benefit requires both a significant allocation to duration and, of course, negative stock-bond correlation.
Figure 3: A significant allocation to duration and negative stock-bond correlation are both required
Equity drawdown offset from a -50 bps decline in US Treasury yields
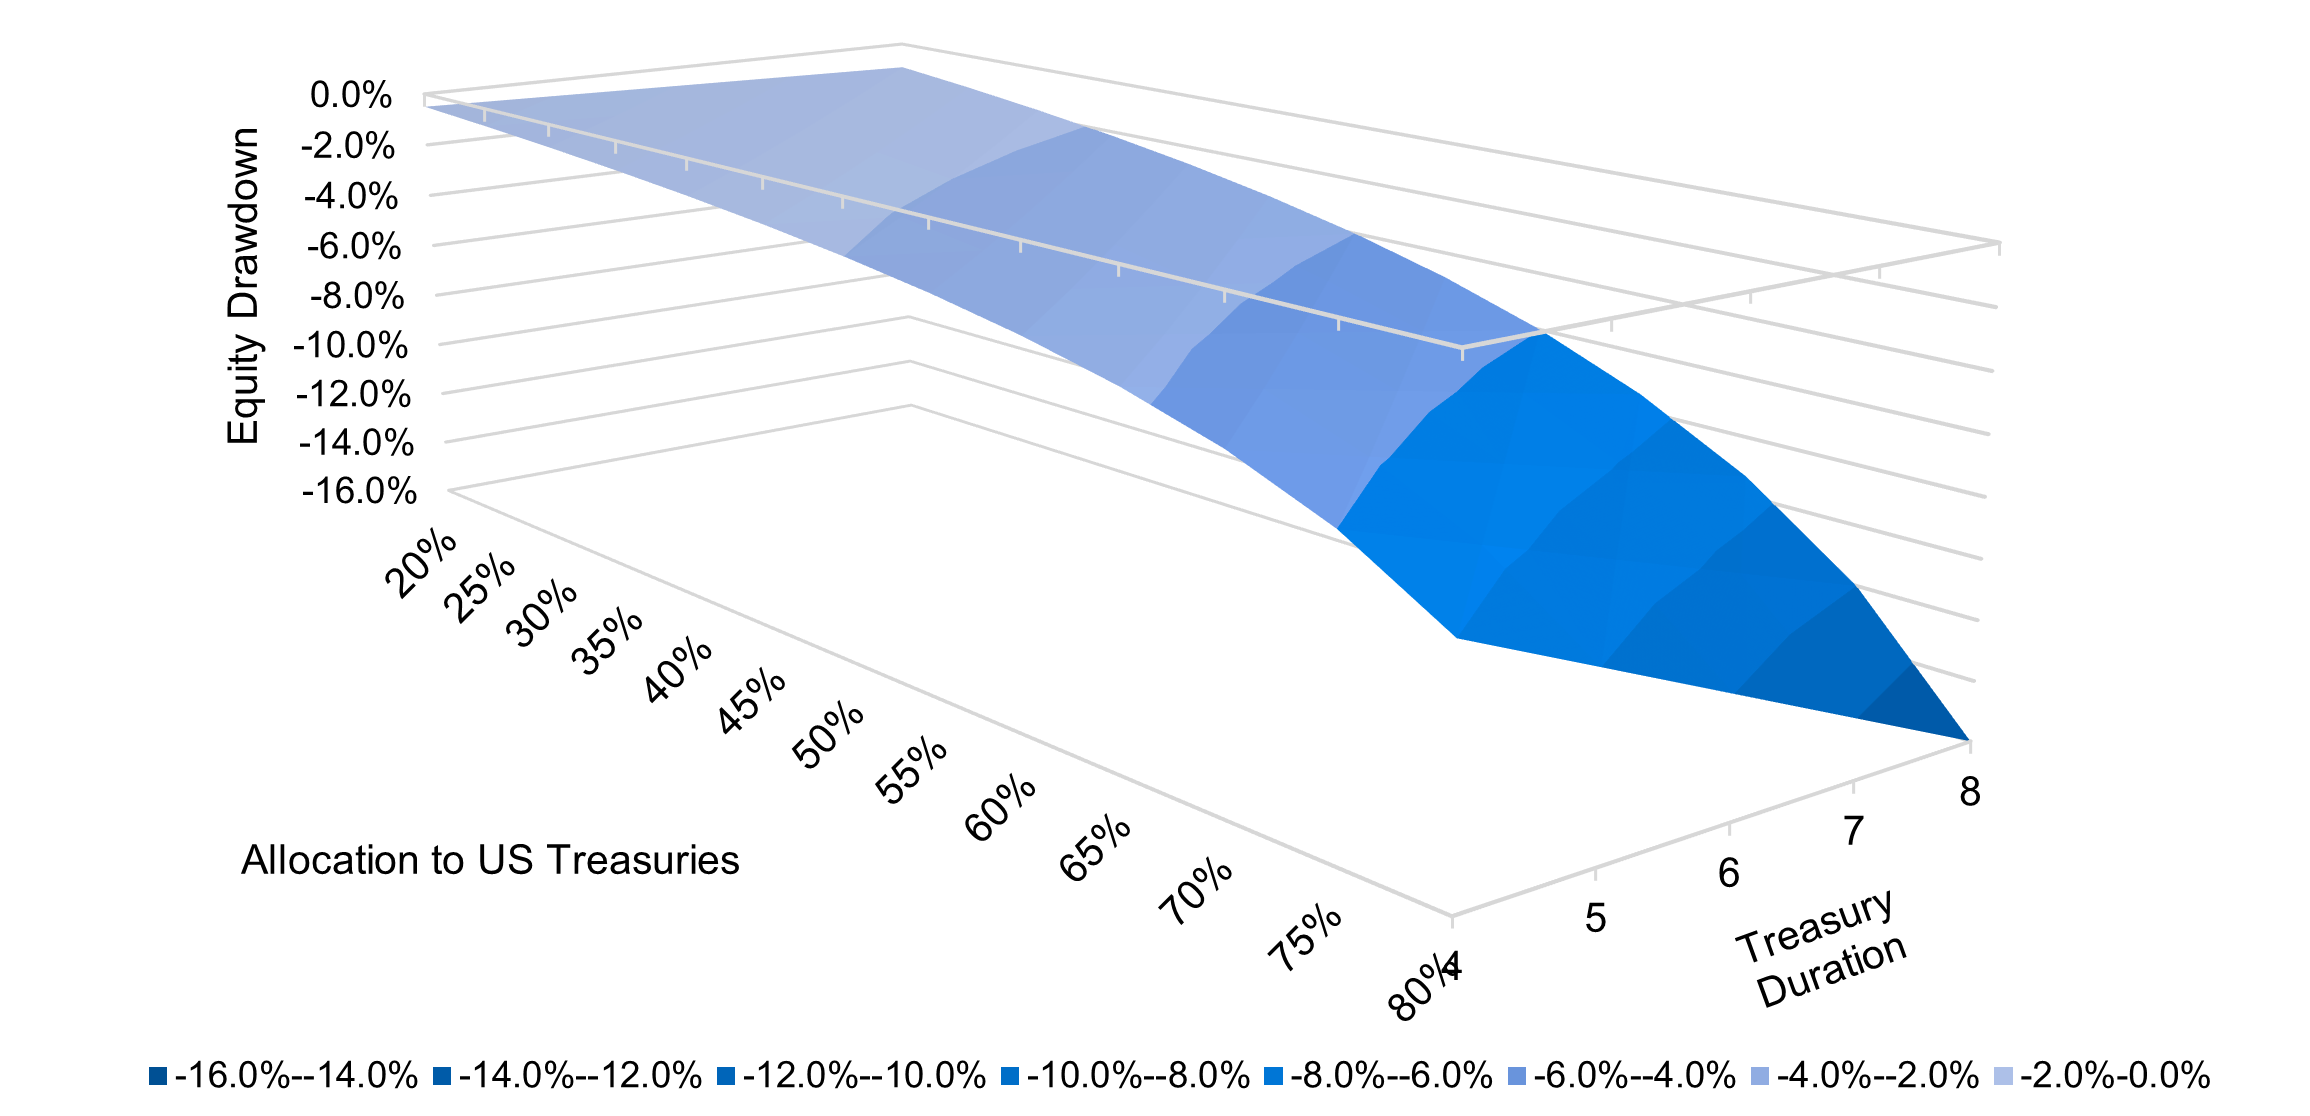
Source: L&G – Asset Management, America and Bloomberg. For illustrative purposes only.
Looking at the full menu
Diversification, duration extension and hedging are the three common approaches to managing risk for a balanced portfolio. Public pensions have been adding additional diversifying strategies for decades. However, some have failed to provide diversification when it was needed most (e.g., some hedge fund strategies) and others have come with a price of illiquidity at a time when liquidity is needed. Other diversifying strategies like commodities and liquid real assets can provide diversification but have not been allocated sufficient capital.
Extending duration is straightforward and easily benchmarked. It may also align with the long-dated cash flows of public plans. However, the portfolio impact is particularly reliant on negative stock-bond correlation. So, investors concerned specifically with positive stock-bond correlation recognize this approach as a double-edged sword for shorter-term rate movements (while still potentially being aligned with more strategic, long-term cash flow objectives).
Hedging can be direct but is generally viewed as more expensive. There are long-held beliefs that the implied volatility premium paid for owning options is excessive (although a negative stock-bond correlation is also a long-held belief…), yet systematic volatility sellers have changed this dynamic significantly. Further, to mitigate stocks-down, bonds-down environments, contingent options and their replication are a viable way to reduce hedging costs. An example of such option is a 95% put on the S&P 500 that only pays off if rates rise 10 bps more than expected over the same horizon.
The right combination of approaches to managing risk ultimately depends on an investor’s strategic asset allocation, liquidity profile, funded status and ability to utilize certain instruments. Yet the risk of episodic, or perhaps even secular, positive stock-bond correlation is an opportunity to think creatively and build more resilient portfolios on behalf of your beneficiaries.
1. Source: Bloomberg.
Disclosures
The material in this presentation regarding L&G – Asset Management, America is confidential, intended solely for the person to whom it has been delivered and may not be reproduced or distributed. The material provided is for informational purposes only as a one-on-one presentation and is not intended as a solicitation to buy or sell any securities or other financial instruments or to provide any investment advice or service. Where applicable, offers or solicitations will be made only by means of the appropriate Fund’s confidential offering documents, including related subscription documents (collectively, the
Certain information contained in this document constitutes “forward-looking statements,” which can be identified by the use of forward-looking terminology such as “may,” “will,” “should,” “seek,” “expect,” “anticipate,” “target,” “project,” “estimate,” “intend,” “continue,” “believe,” the negatives thereof, other variations thereon or comparable terminology. Due to various risks and uncertainties, actual events or results or the actual performance of the Fund may differ materially from those reflected or contemplated in such forward-looking statements.
In certain strategies, L&G – Asset Management, America might utilize derivative securities which inherently include a higher risk than other investments strategies. Investors should consider these risks with the understanding that the strategy may not be successful and work in all market conditions.
Reference to an index does not imply that an L&G – Asset Management, America portfolio will achieve returns, volatility or other results similar to the index. You cannot invest directly in an index, therefore, the composition of a benchmark index may not reflect the manner in which an L&G – Asset Management, America portfolio is constructed in relation to expected or achieved returns, investment holdings, portfolio guidelines, restrictions, sectors, correlations, concentrations, volatility, or tracking error targets, all of which are subject to change over time.
No representation or warranty is made to the reasonableness of the assumptions made or that all assumptions used to construct the performance provided have been stated or fully considered.
These assumptions are theoretical and intended to provide a conceptual framework for understanding how certain investment strategies or models might operate under idealized conditions. These assumptions do not reflect actual market conditions or specific investor circumstances. Hypothetical scenarios may simplify complex market dynamics and investor behaviors. They may not fully capture the impact of variables such as market volatility, liquidity constraints, or transaction costs. The assumptions used may have inherent limitations and may not accurately represent future market conditions or investor experiences. They are designed for illustrative purposes only and should not be interpreted as predictive of actual performance or outcomes.
There is no guarantee that actual results will match the outcomes suggested by these hypothetical assumptions. Real-world investing involves risks and uncertainties that may differ from the assumptions made in these scenarios. Investors should carefully consider their own financial situation, risk tolerance, and investment goals before making decisions based on hypothetical assumptions. It is recommended to consult with a financial advisor to understand how these assumptions might apply to actual investment scenarios.
Certain information contained in these materials has been obtained from published and non-published sources prepared by third parties, which, in certain cases, have not been updated through the date hereof. While such information is believed to be reliable, L&G – Asset Management, America has not independently verified such information, nor does it assume any responsibility for the accuracy or completeness of such information. Except as otherwise indicated herein, the information, opinions and estimates provided in this presentation are based on matters and information as they exist as of the date these materials have been prepared and not as of any future date and will not be updated or otherwise revised to reflect information that is subsequently discovered or available, or for changes in circumstances occurring after the date hereof. L&G – Asset Management, America’s opinions and estimates constitute L&G – Asset Management, America’s judgment and should be regarded as indicative, preliminary and for illustrative purposes only.