The Truth About Gen Z and US Apartment Demand

Demographic demand for apartments is shifting from the mature millennial generation to the up-and-coming Gen Z generation. As such, apartment investors are well-advised to seek out metro area locations that are attractive to Gen Zers. But, as our analysis shows, attention to absolute numbers of Gen Zers is more important than growth rates when it comes to determining where Gen Z is truly driving US apartment demand, a fact that developers in some areas appear to have misunderstood.
Gauging Gen-Z demand
Millennials include those born between 1981 and 1996; the youngest are 29 this year and well past the transition into adulthood. Gen Zers were born between 1997 and 2012; the oldest are 28 this year. The Gen-Z cohort is nearly as large as the millennial cohort, as Figure 1 shows, and it will fuel apartment demand for many years ahead.
Figure 1: Gen Zers will drive apartment demand for years to come
Population distribution in the United States in 2024, by generation
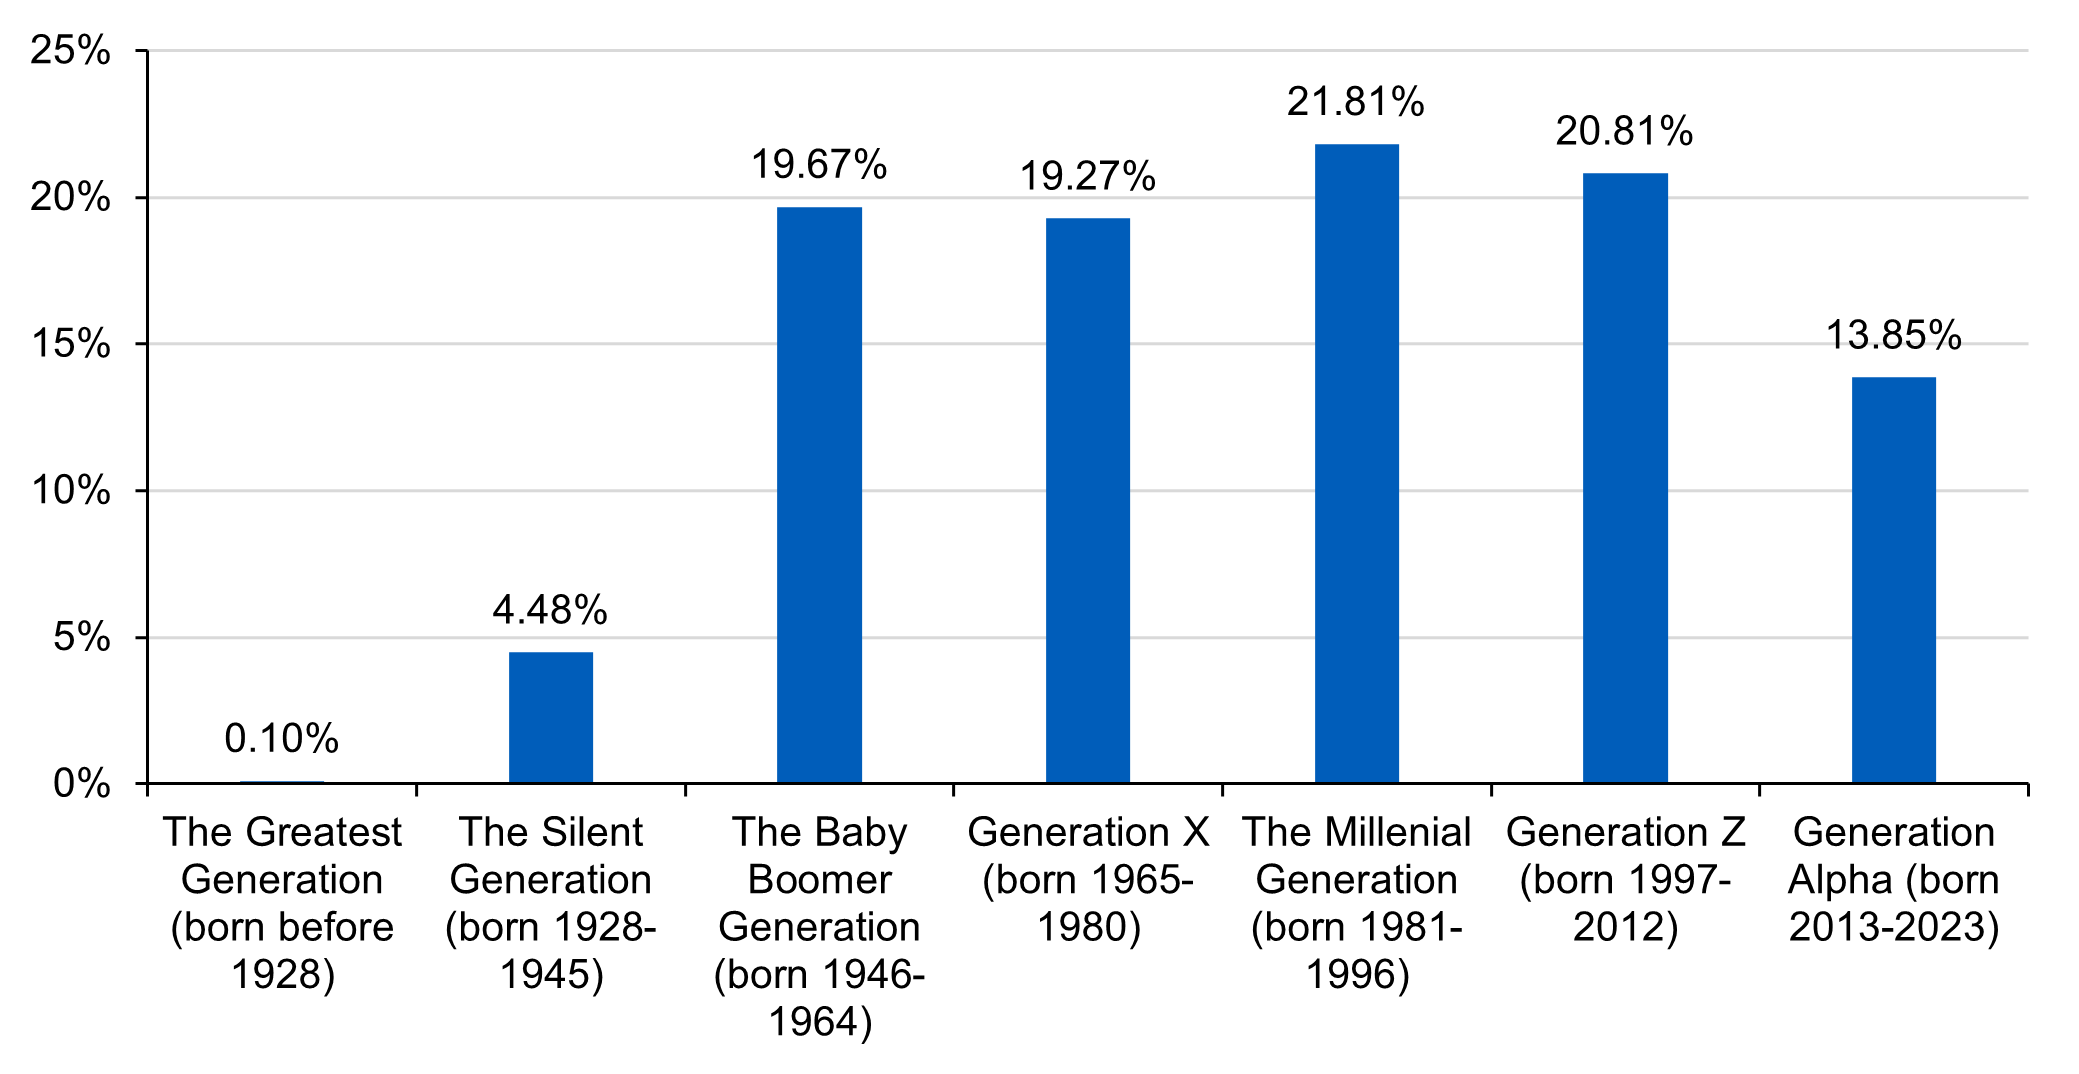
Source: US Census Bureau. Data as of July 1, 2024.
Millennials drove culture and apartment demand as they matured, but the bulk of that generation is now settled. The latest US Census American Housing Survey shows 61% of older millennial households (35-44 years old) were homeowners in 2023, a ratio close to the 68% among older Gen Xers (45-54 years old). Younger millennials who are now 30-34 years old lag, with 46% owning homes. If younger millennials boost their ownership rate to match the 61% of older millennials, 1.6 million households will shift from renting to owning.
At the same time, maturing Gen Zers can more than fill that potential void. According to US Census data, those sharing rentals compose 23% of older Gen Zers compared with only 12% of younger millennials. If those Gen-Z roommates separate to a similar ratio, they will form 870,000 new households.
But we believe more apartment demand will come from the 22.4 million younger Gen Zers in the 20-24 cohort. The size of this cohort is in line with the older Gen-Z cohort but slightly smaller than the millennial cohorts that preceded it, as shown in Figure 2. Beyond the large size of the cohort, many Gen Zers live with parents, suggesting huge potential demand for housing. (Note that living in a dorm is included with living with parents.)
Figure 2: Gen-z cohorts are slightly smaller than preceding millennial cohorts
2024 Population by age: Gen-Z highlighted
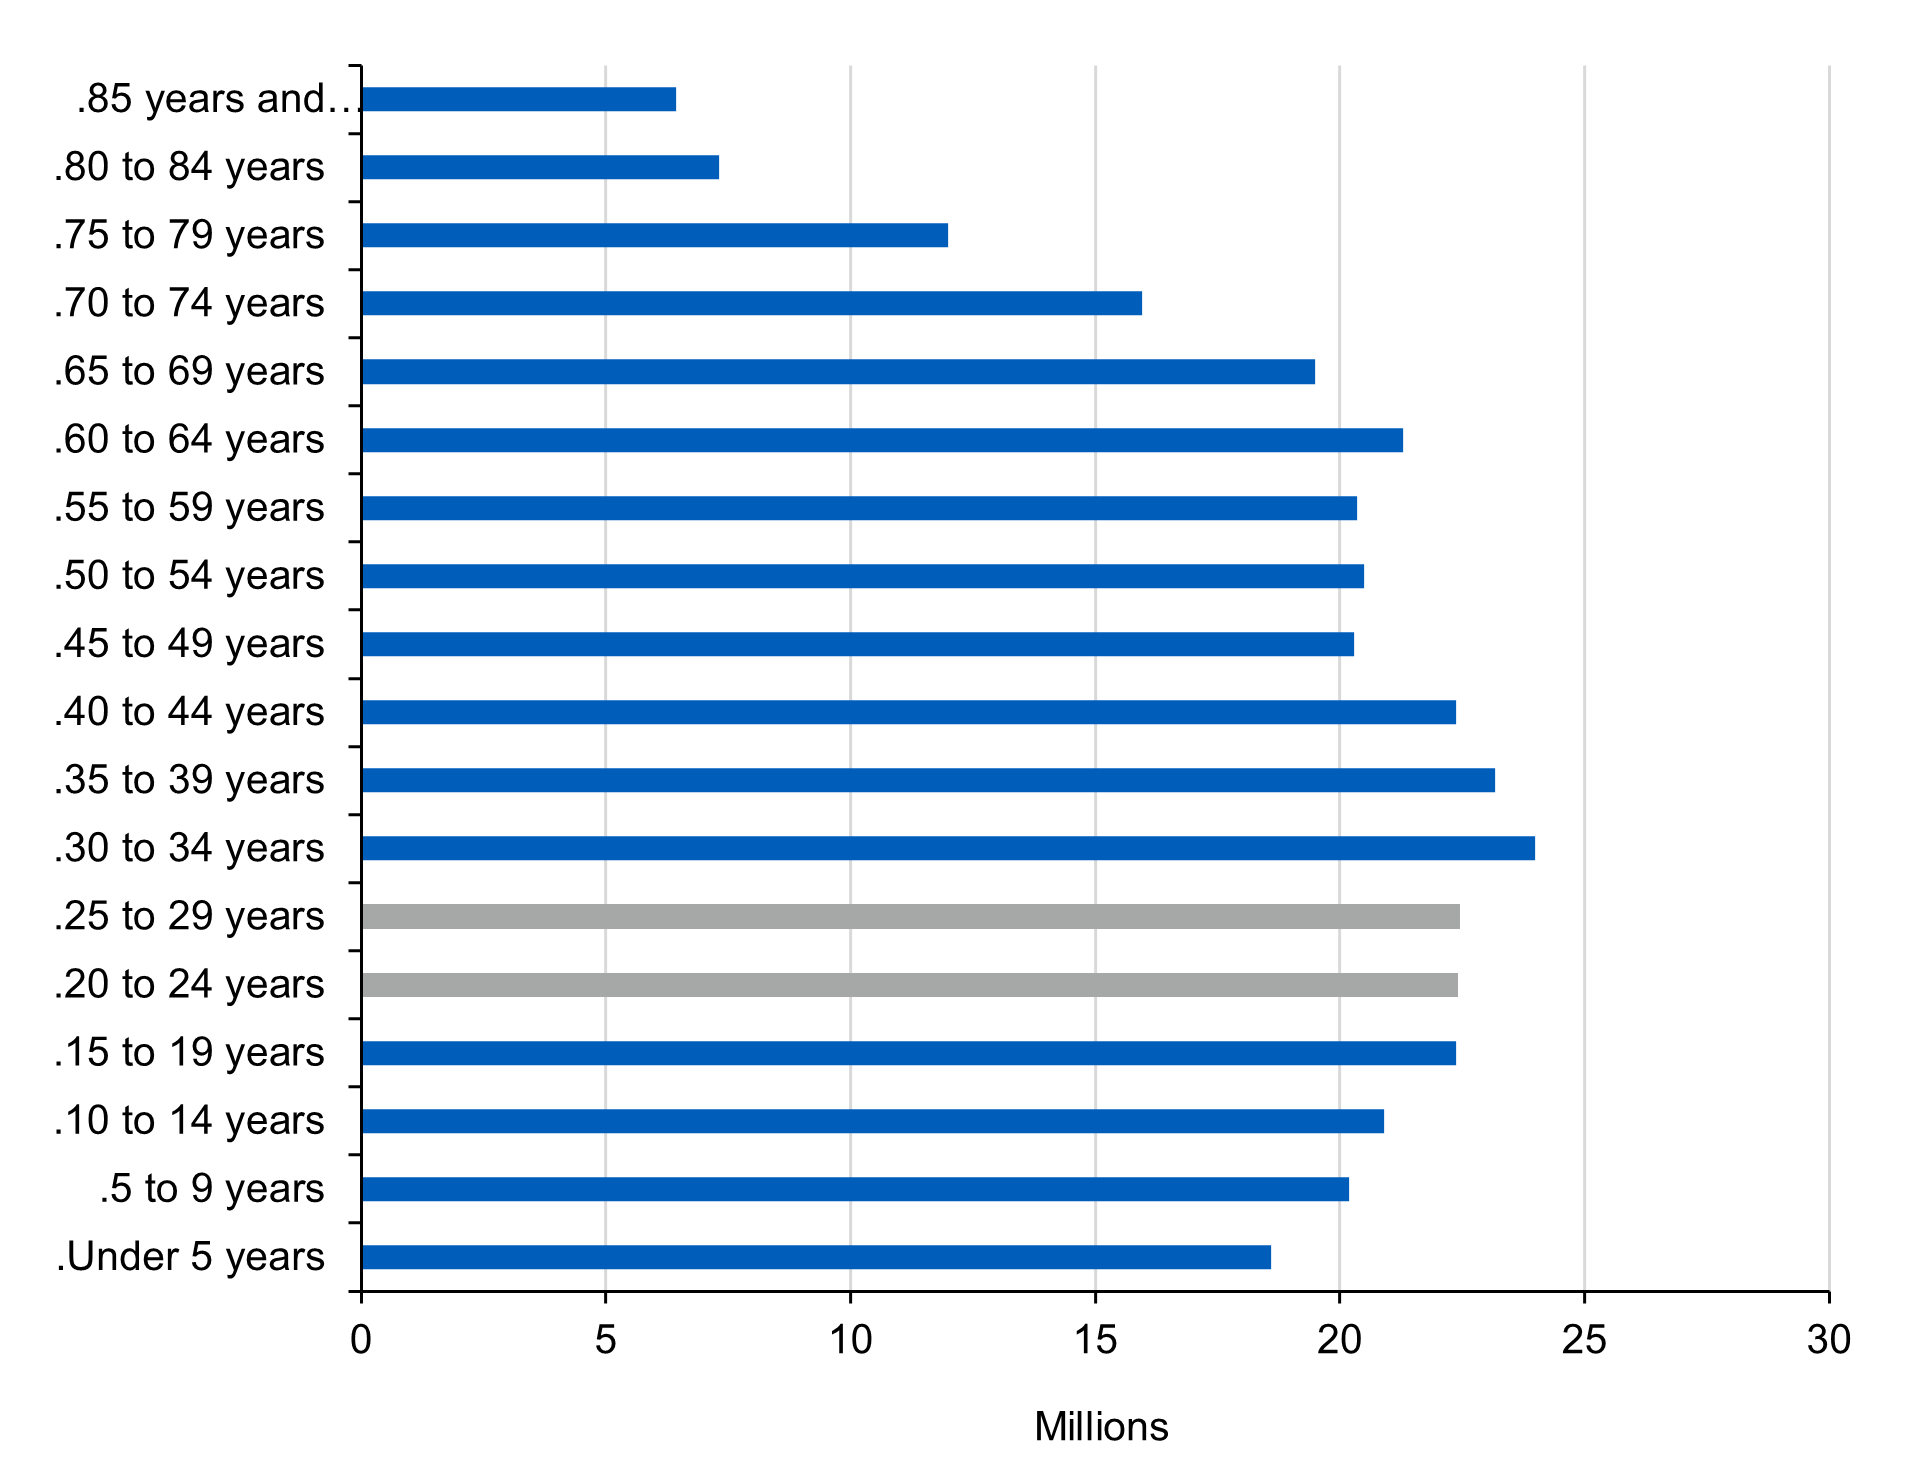
Source: US Census Bureau. Data as of July 1, 2024.
The most recent Census data for living arrangements show that more than half of younger Gen Zers lived with parents in 2024, while in the 25-29 age group, 19% of men and 13% of women lived with parents. If the percentage of those living with parents drops from 50% to 25%, roughly 6 million younger Gen Zers will be in the market for rental apartments in the next few years. Even if they all double-up with roommates, demand will increase by 3 million units, with Gen Z driving apartment demand.
Locating the Gen-Z demand
Separating Gen Zers into two cohorts reflects the assumption that the older cohort is largely finished with education, employed and settled in a metro area of choice. The younger cohort may still be in school, living with parents and not yet up to job and location decisions.
Apartment investors looking for metros with growing demand need to make assumptions about where younger Gen Zers will decide to live as they mature. To inform those assumptions, it is reasonable to assume that younger Gen Zers will make location choices similar to the older Gen-Z cohort.
The tables below rank the top ten metro areas for the younger cohort of Gen-Zers, as measured by the absolute number of the cohort population in each area (Figure 3) and the growth rate of those numbers between 2000 and 2024 (Figure 4). Both tables also show absolute numbers and growth rates for the older Gen-Z cohort as well, for comparison.
It should not be surprising that the top ten metros for younger Gen Zers are also the top metros in overall population. The only exception is Boston, which is number 11 in overall population but a top ten metro for younger Gen Zers as measured by absolute numbers. Also note that the top metros for Gen Zers are not necessarily those that are showing the strongest percentage growth in the Gen-Z population. The tables show that Dallas, Houston and Phoenix are the only metro areas among the top ten for Gen-Z population size that are also among the areas with the fastest growing Gen-Z populations.
The top ten metros for the older Gen-Z cohort as measured by absolute numbers are also slightly different than that for the younger cohort, with Phoenix replacing Boston. Similarly, when looking at growth rates of older Gen-Z populations, Nashville and Tampa replace San Jose and Jacksonville in the top 10 metro areas. Looking forward, assuming that younger Gen Zers will make location choice similar to older Gen Zers, they are like to congregate in the Dallas, Houston and Phoenix metro areas.
Figure 3: Top metros ranked by number of younger Gen Zers
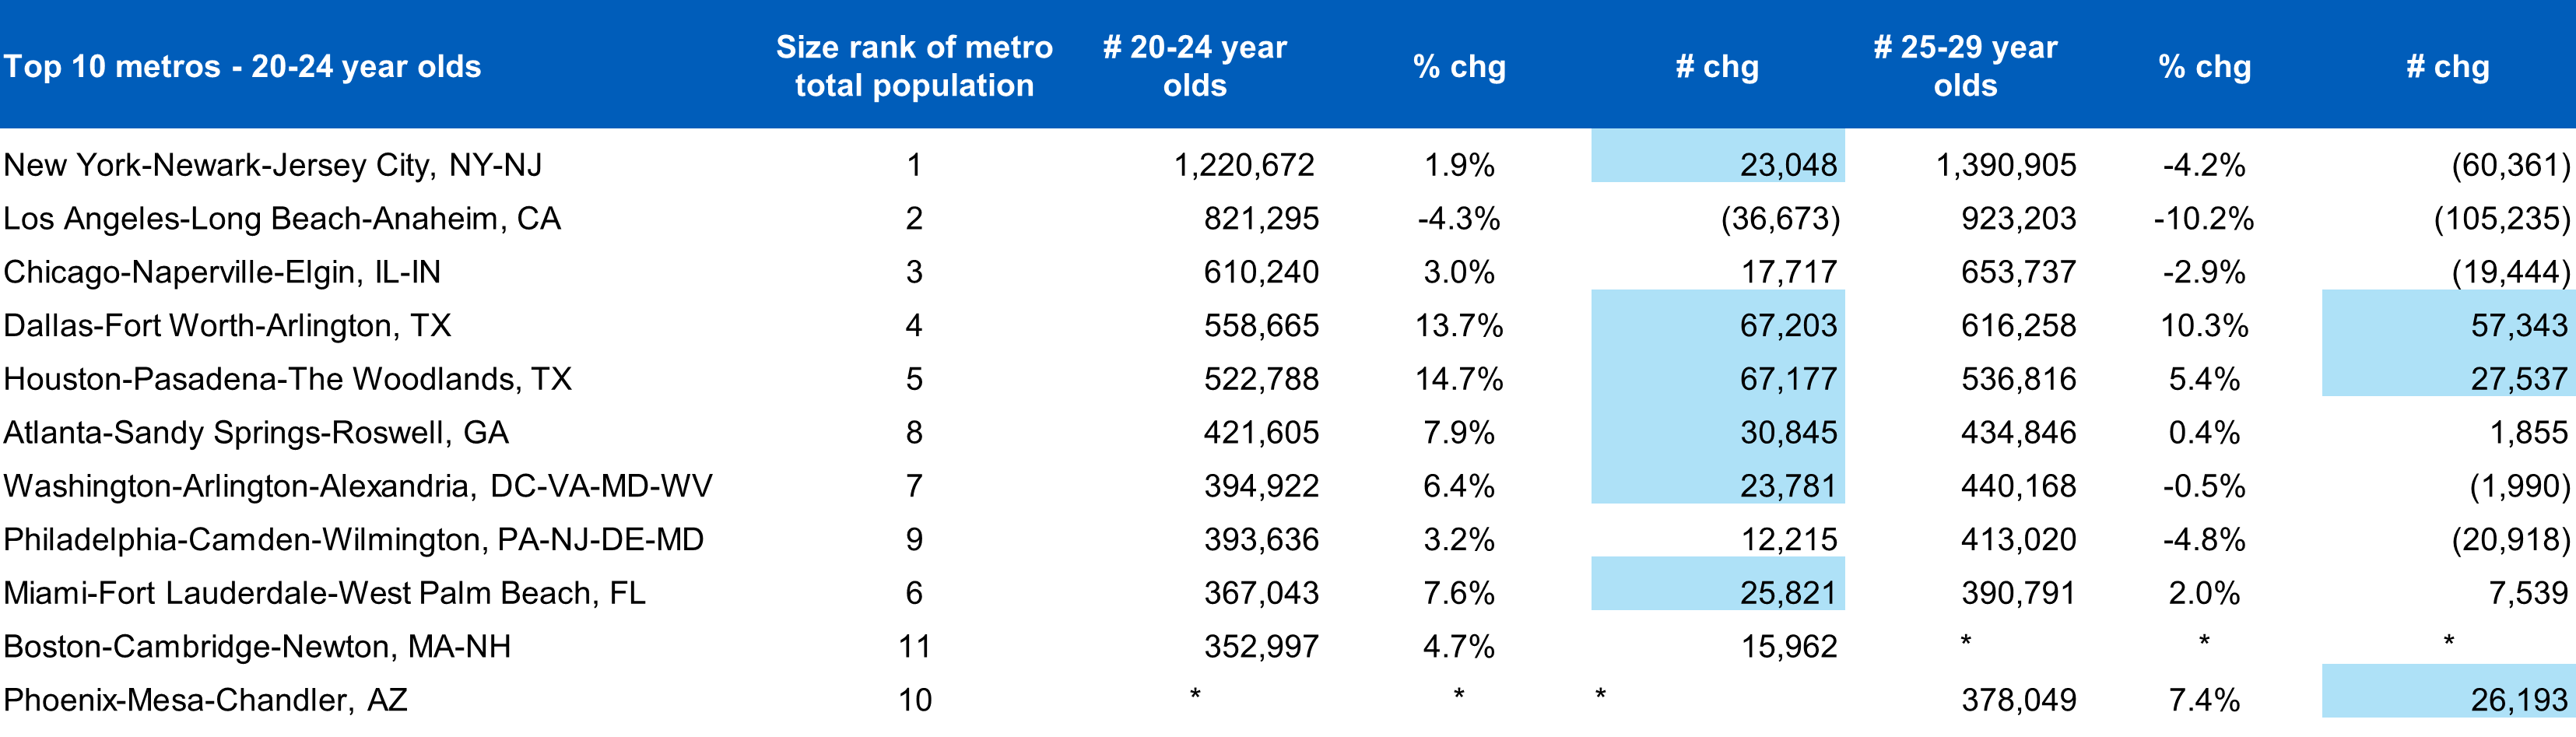
Source: US Census Bureau, American Community Survey, 2024. Metro areas are ranked by the number of 20–24-year-olds in 2024.
Figure 4: Top metros ranked by 2000-2024 growth rate of Gen Zers
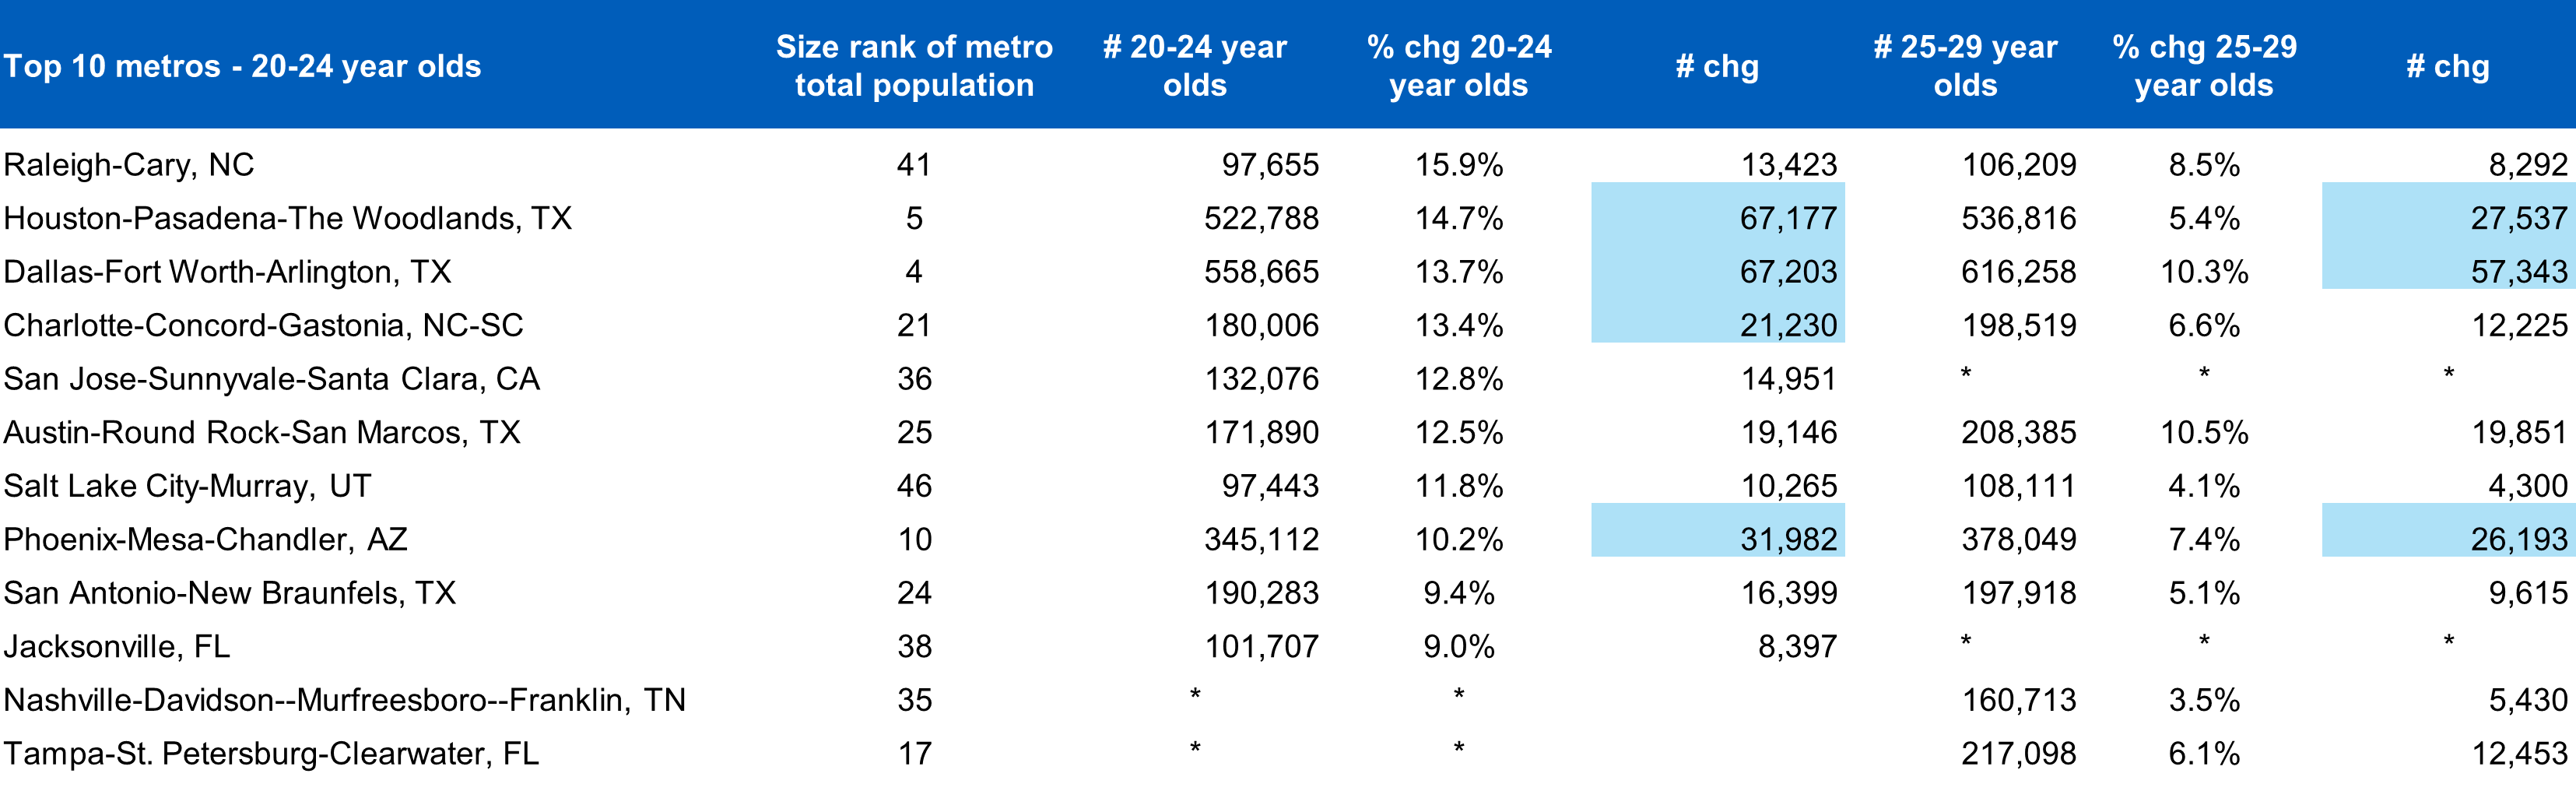
Source: US Census Bureau, American Community Survey, 2024. Metro areas are ranked by the number of 20–24-year-olds in 2024.
Analyzing metro-area apartment metrics
Recent excess construction in apartments appears to reflect developers focusing on Gen-Z population growth rates rather than absolute growth. Results of our research show a strong correlation between current apartment market vacancy rates and the 2020-2025 growth rate in older Gen-Z population, suggesting that developers were motivated by these growth rates. The correlation coefficient is 0.74, and the positive relationship is clearly shown in Figure 5.
Moreover, the correlation is also strong at 0.50 between 2020-2025 growth in older Gen Zers and currently under-construction apartment units, despite higher vacancy rates. However, few of the metros with high growth rates in this population segment enjoyed large additions in absolute numbers of Gen Zers, implying that developers motivated by growth rates were misled and higher vacancy rates resulted.
Figure 5: Vacancy rates and older Gen-Z growth rates appear strongly correlated
Metro vacancy rates and 25-29-year-old growth rates
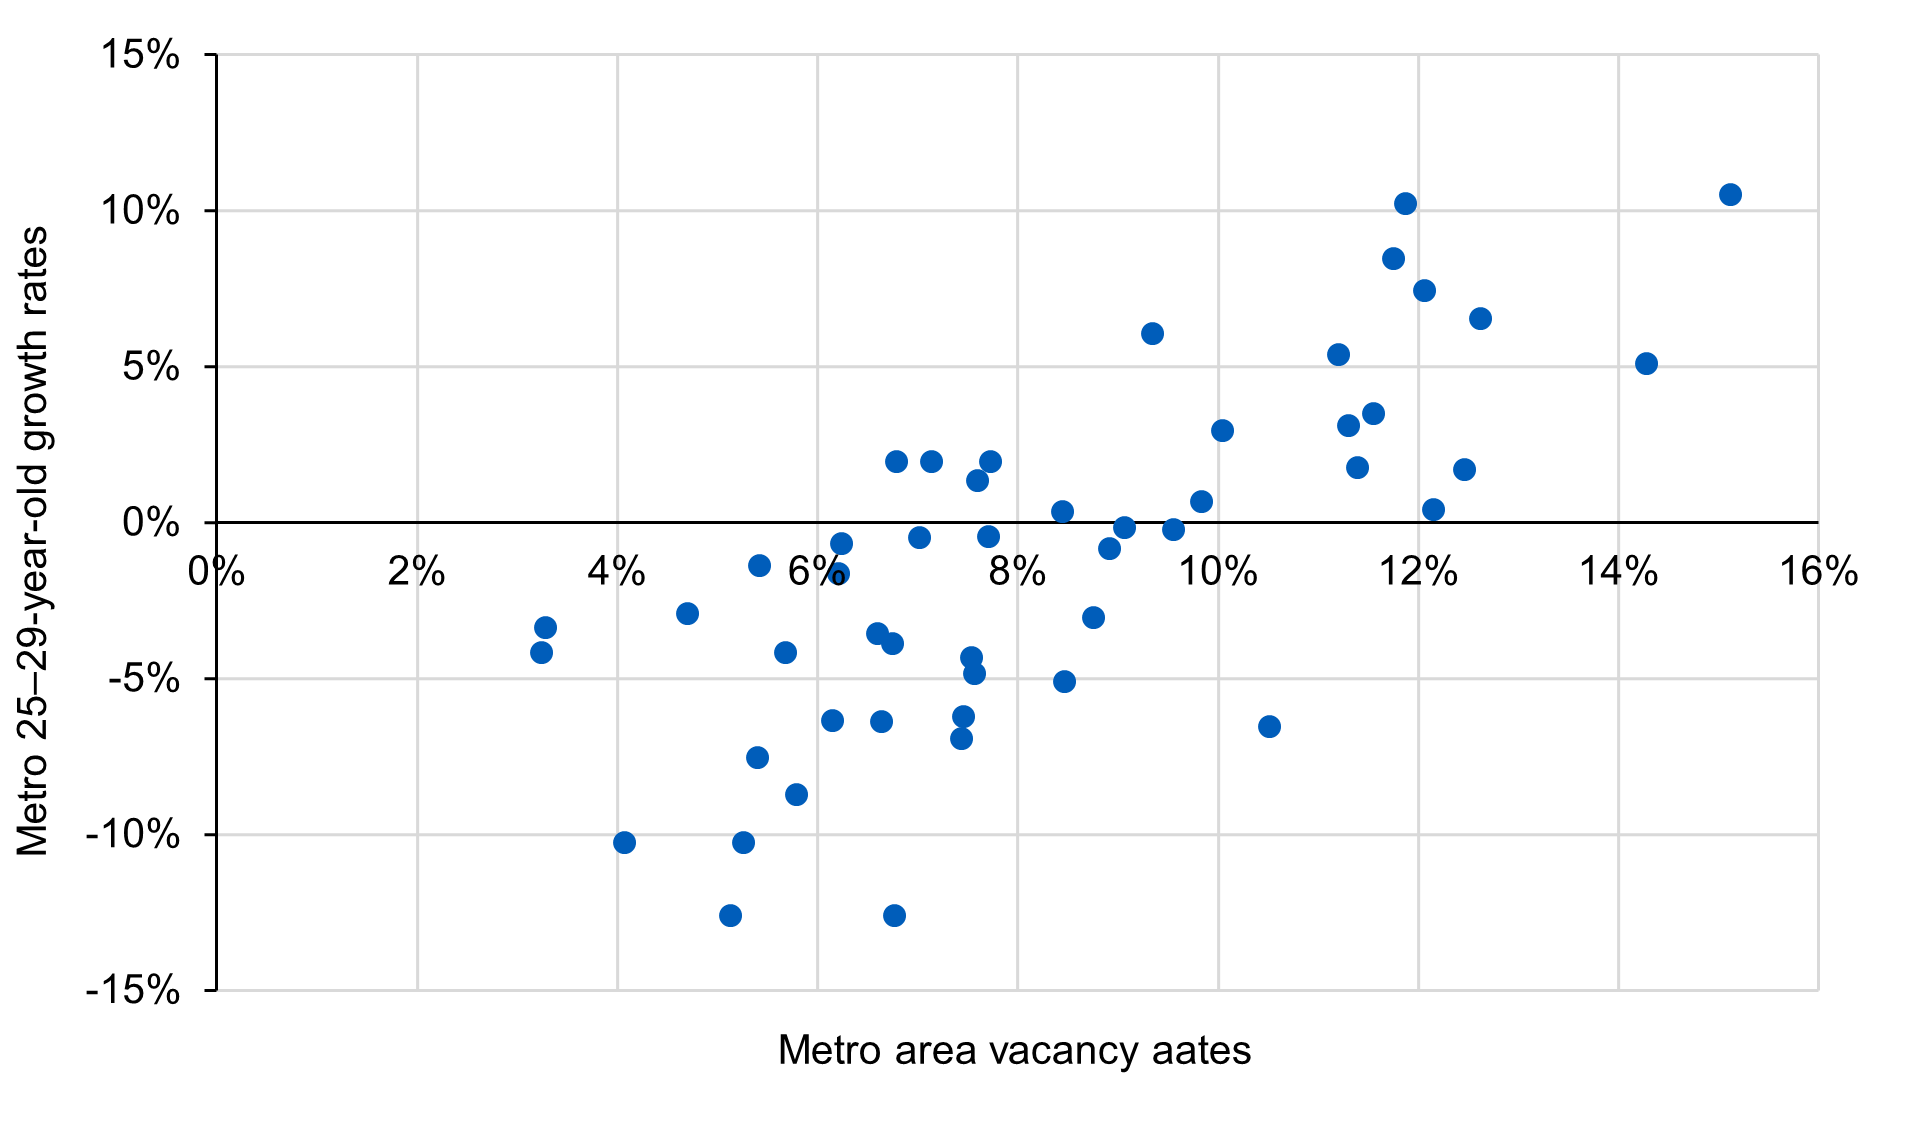
Source: Costar US Census Bureau.
Bottom line
Apartment investors are well-advised to seek out metro area locations that are attractive to Gen Zers, as measured by Gen-Z absolute growth in addition to Gen-Z growth rates. In addition, investors should recognize that population growth is not the only factor contributing to the attractiveness of metro locations for apartment investment. Industry concentrations, local amenities, school quality, climate and living costs are also important to individuals making location choices. They should be important to investors as well.
Martha Peyton, Research Consultant, L&G – Asset Management, America, authored this blog.
Disclosures
Legal & General Investment Management America, Inc. (d/b/a L&G – Asset Management, America) (“LGIMA”, “LGIM America”) is a registered investment adviser with the U.S. Securities and Exchange Commission (“SEC”). LGIMA provides investment advisory services to U.S. clients. L&G’s asset management division more broadly—and the non-LGIMA affiliates that comprise it—are not registered as investment advisers with the SEC and do not independently provide investment advice to U.S. clients. Registration with the SEC does not imply any level of skill or training.
The material in this presentation regarding L&G – Asset Management, America is confidential, intended solely for the person to whom it has been delivered and may not be reproduced or distributed. The material provided is for informational purposes only as a one-on-one presentation and is not intended as a solicitation to buy or sell any securities or other financial instruments or to provide any investment advice or service. Where applicable, offers or solicitations will be made only by means of the appropriate Fund’s confidential offering documents, including related subscription documents (collectively, the “Offering Materials”) that will be furnished to prospective investors. Before making an investment decision, investors are advised to carefully review the Offering Materials, and to consult with their tax, financial and legal advisors. L&G – Asset Management, America does not guarantee the timeliness, sequence, accuracy or completeness of information included. The information contained in this presentation, including, without limitation, forward looking statements, portfolio construction and parameters, markets and instruments traded, and strategies employed, reflects L&G – Asset Management, America’s views as of the date hereof and may be changed in response to L&G – Asset Management, America’s perception of changing market conditions, or otherwise, without further notice to you. Accordingly, the information herein should not be relied on in making any investment decision, as an investment always carries with it the risk of loss and the vulnerability to changing economic, market or political conditions, including but not limited to changes in interest rates, issuer, credit and inflation risk, foreign exchange rates, securities prices, market indexes, operational or financial conditions of companies or other factors. Past performance should not be taken as an indication or guarantee of future performance and no representation, express or implied, is made regarding future performance or that L&G – Asset Management, America’s investment or risk management process will be successful.
Certain information contained in this document constitutes “forward-looking statements,” which can be identified by the use of forward-looking terminology such as “may,” “will,” “should,” “seek,” “expect,” “anticipate,” “target,” “project,” “estimate,” “intend,” “continue,” “believe,” the negatives thereof, other variations thereon or comparable terminology. Due to various risks and uncertainties, actual events or results or the actual performance of the Fund may differ materially from those reflected or contemplated in such forward-looking statements.
Unless otherwise stated, references herein to "L&G", "we" and "us" are meant to capture the global conglomerate that includes Legal & General Investment Management Ltd. (a U.K. FCA authorized adviser), Legal & General Investment Management America, Inc. (a U.S. SEC registered investment adviser) Legal & General Investment Management Asia Limited (a Hong Kong SFC registered adviser) , Legal & General Investment Management Japan KK (licensed by the FAS in Japan), and LGIM Singapore Pte. Ltd. (licensed by the MAS in Singapore).
We have more blogs to share
Visit our blog site to explore our latest views on markets, investment strategy and long-term themes.