In the Age of Surplus, Invest Like an Insurer

Funding levels for corporate defined benefit (DB) plans have been on the rise in recent years. In fact, many plans are now in a surplus position and have the luxury to weigh the considerations between (1) de-risking through a pension risk transfer (PRT) to an insurer and (2) managing the portfolio in a hibernation strategy to preserve and improve the funding level as plan liabilities run-off over time. Holding off on a buyout, however, begs the question of how to invest the surplus to realize the potential benefits that the financial cushion may provide. Our answer: Look to the insurance industry for an investment framework.
Growing attention around surplus and the optionality it offers
DB pension plans have seen material improvements in funding levels over the last decade. According to L&G’s Pension Solutions Monitor, the average funding ratio across the corporate DB landscape now exceeds 110%, continuing a trend of improvements since the COVID pandemic.1
As plan sponsors now find themselves more than fully funded, there has been a growing recognition of the opportunities and flexibility that exist from continuing to manage the plan in run-off mode. These include the potential to generate pension income through the sponsor’s financial statements, the ability to enhance benefits for plan participants, and even the possibility of reopening frozen plans to serve as an employee retention and recruiting tool. More opportunities could be on the horizon as well. This level of surplus is a recent phenomenon, and we anticipate newer, innovative thinking in the coming years on best use cases for a plan’s surplus assets.
As a result, more companies aim to keep their overfunded plans compared to prior years. In our experience, historically, for many underfunded plans, the primary goal was to obtain a funding level between 105-110% so they could pursue a PRT. Market movements and the rise in Treasury yields have catapulted many plans to a surplus position. We’re seeing a pause on those termination plans for many sponsors. Indeed, according to a recent Mercer survey, 50% of plan sponsors do not intend to terminate their DB plans in 2025, up from 36.7% in 2023.2
Taking a cue from insurers
There is no one-size-fits-all solution here. Circumstances matter—investment objectives, time horizon and the size of the surplus (the greater the surplus, the higher the risk tolerance in many cases). Perhaps most important is how much risk a plan sponsor is comfortable with.
For those that wish to pursue a hibernation strategy, the question of how to invest the surplus is front and center. We believe the investing framework used by many insurers is worth considering. It consists of two portfolios: a liability-driven investing (LDI) portfolio and a surplus portfolio.
Figure 1: The investment framework used by many insurers consists of two portfolios
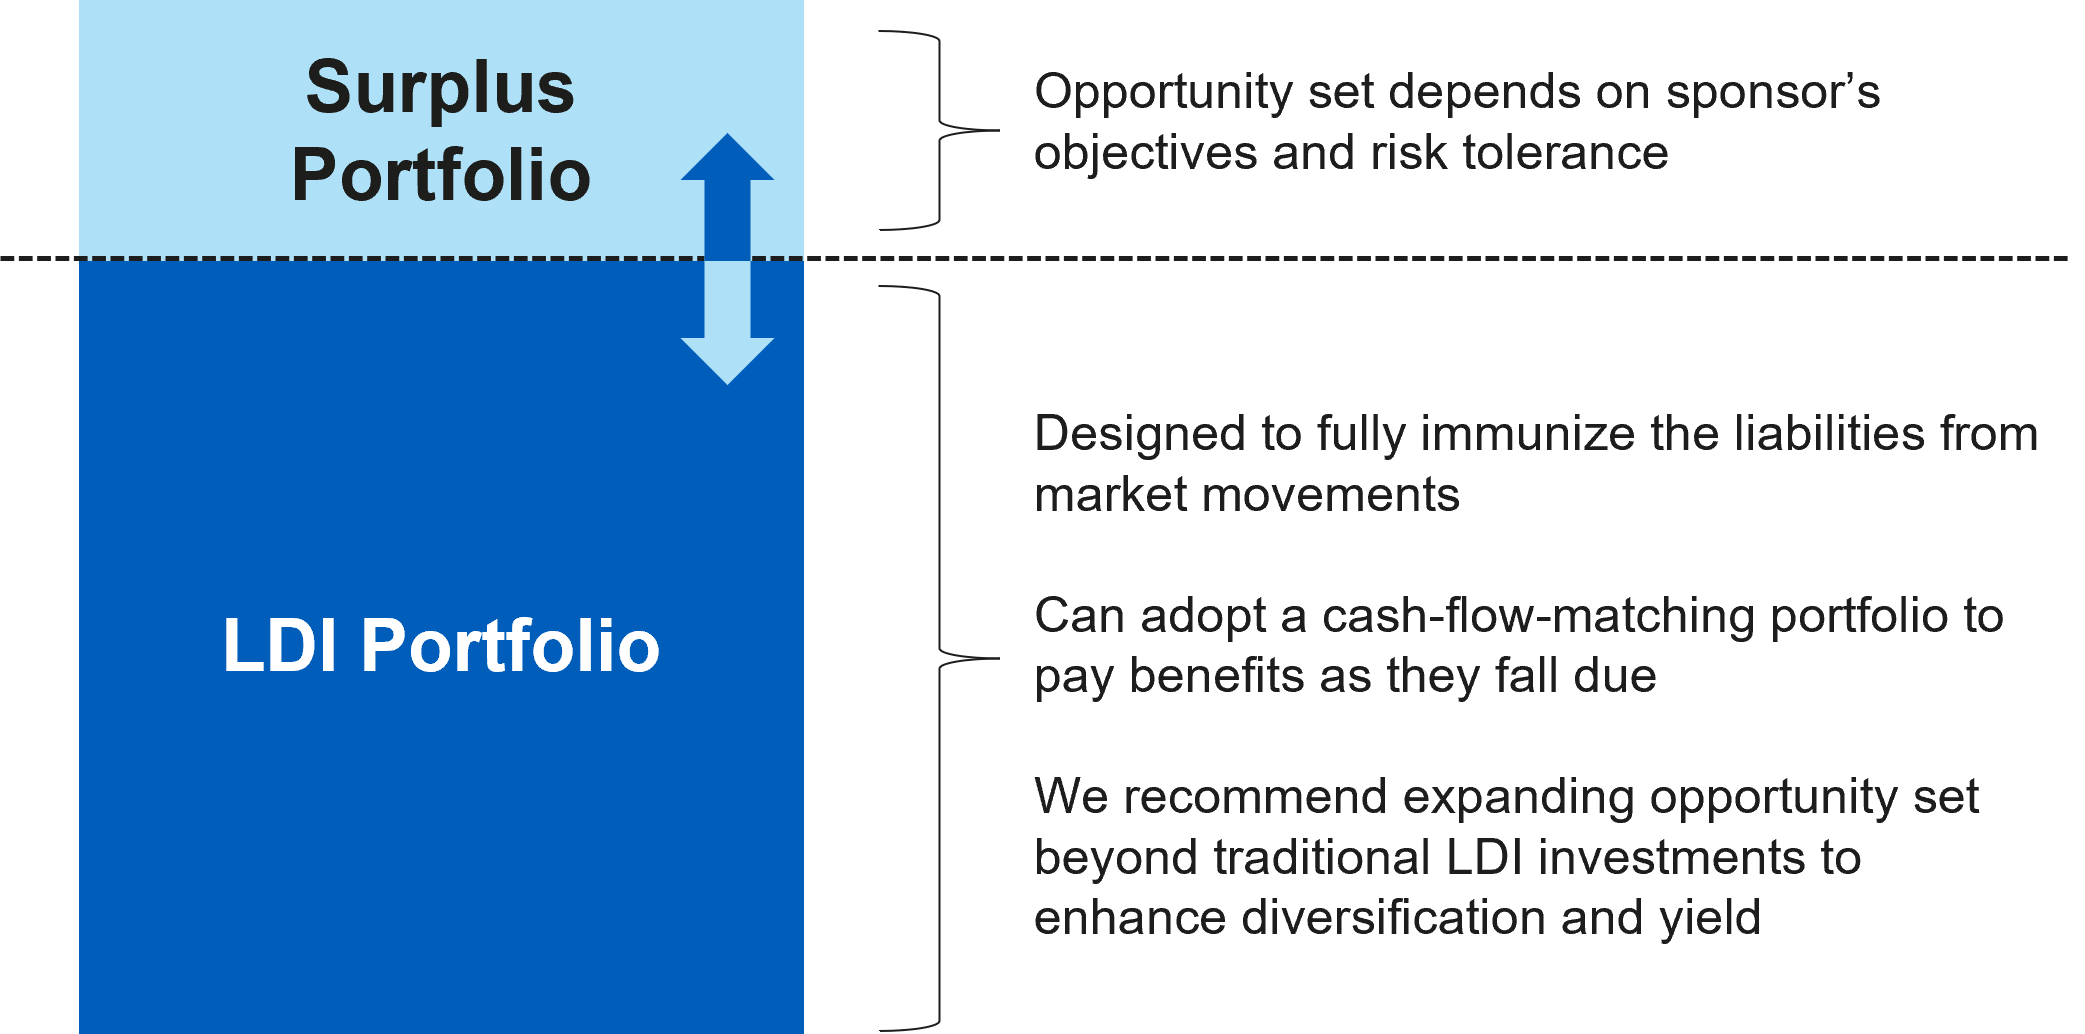
Source: L&G – Asset Management, America. For illustrative purposes only.
The LDI portfolio focuses on meeting benefit payments and covering the Projected Benefit Obligation (PBO), or even a more conservative estimate of the liability. It may include investment grade (IG) corporates, a Treasury component, IG private credit and securitized assets, and it may be managed in a cash-flow-matching context.
The surplus portfolio can be divided into three pots:
- Capital preservation: Low risk, liquid assets. These assets provide a risk buffer against adverse outcomes for the LDI portfolio, while also delivering returns above cash.
- Short-term growth: Liquid investments that offer some growth potential at a moderate risk level.
- Long-term growth: Return-seeking assets with higher growth prospects but also higher short-term risk of loss, such as private assets and equities.
Figure 2: The surplus portfolio can be divided into three pots
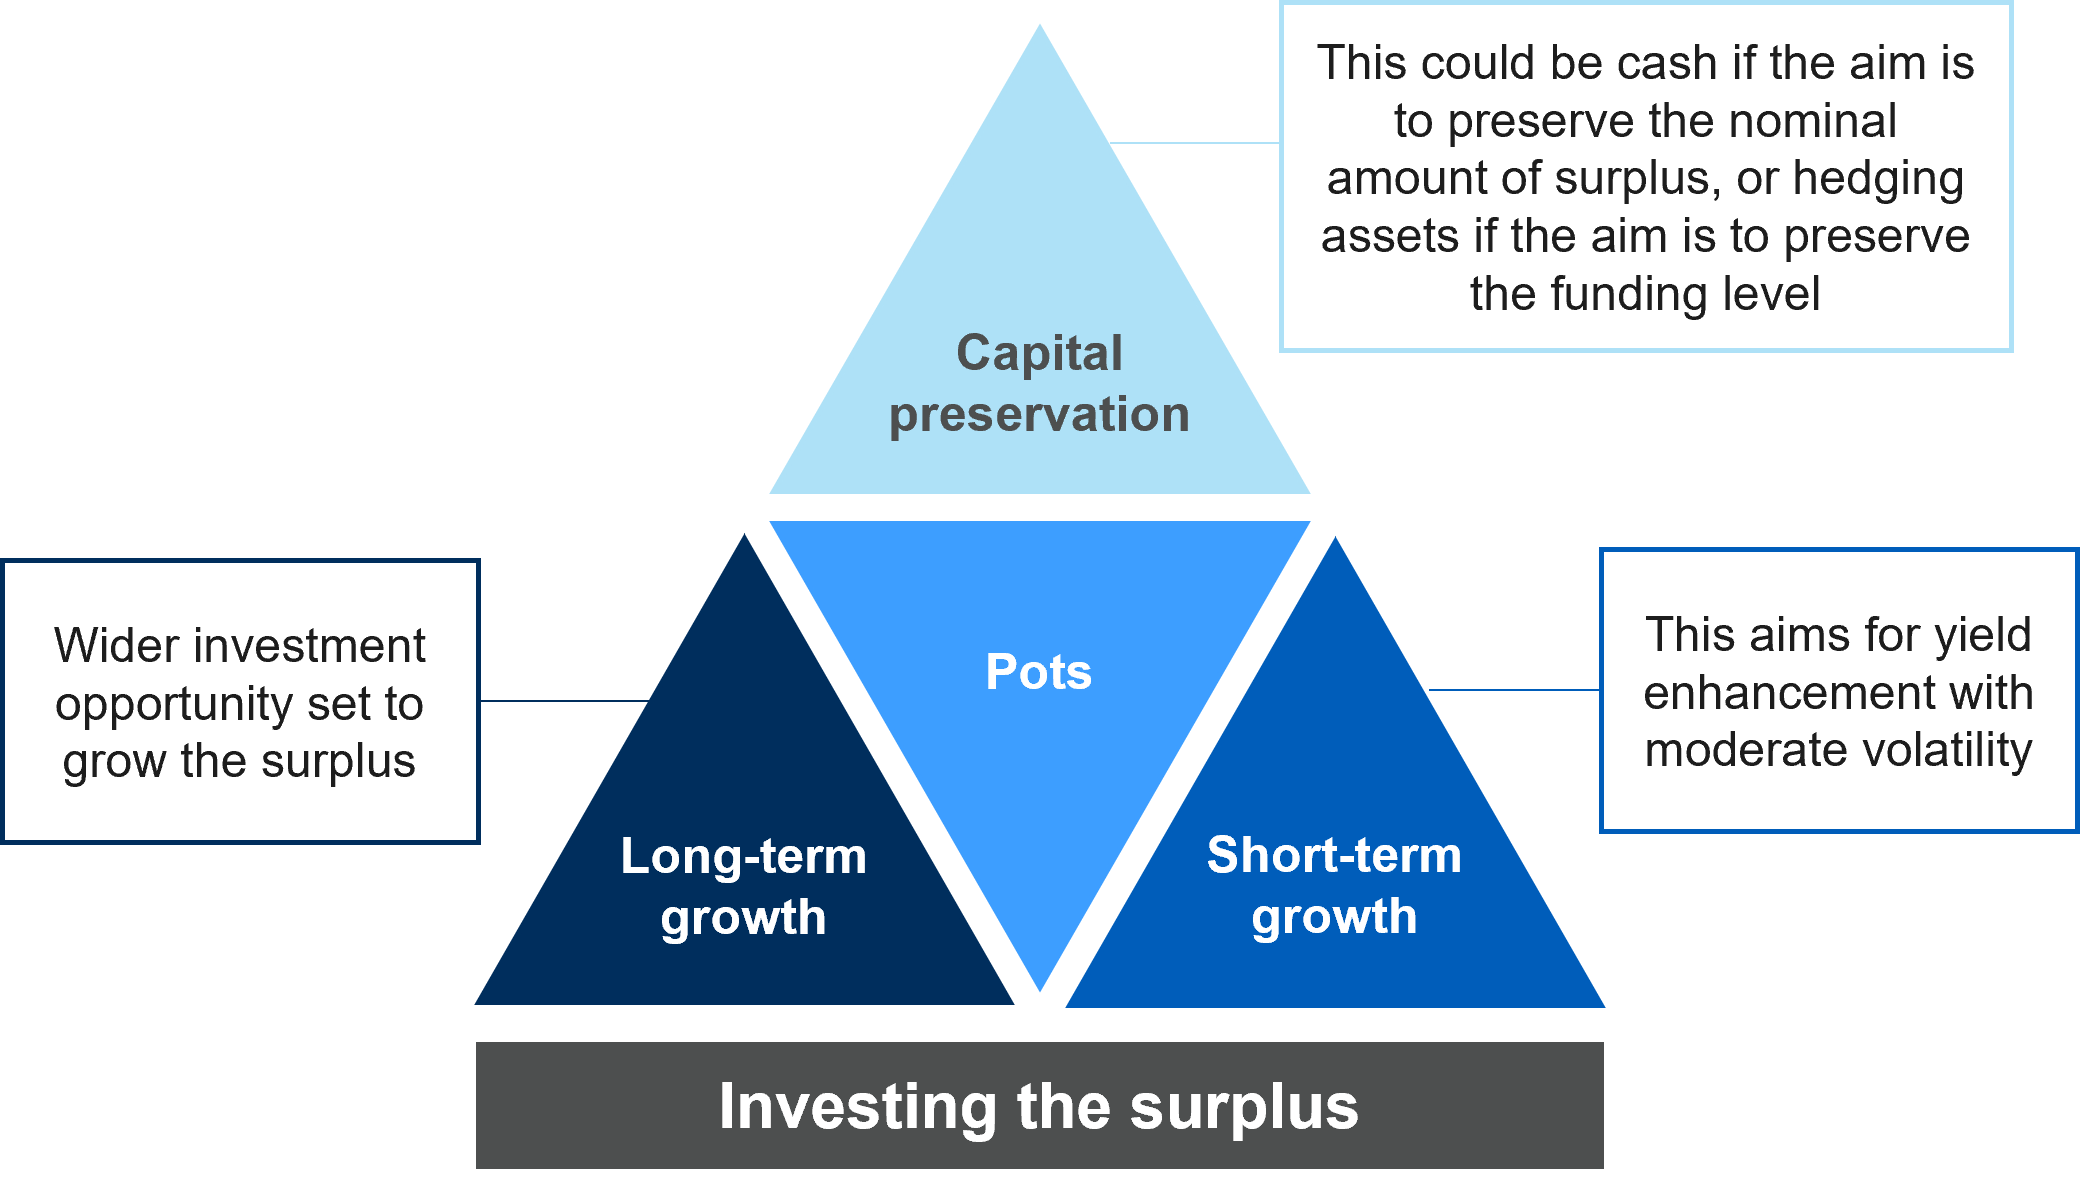
Source: L&G – Asset Management, America. For illustrative purposes only.
The portfolios in action
We use a stochastic model to project the funding level of three different portfolios over a 10-year period (beginning funded status of 125%).
- Total-return approach maintains a broad 60/40 equity / bond asset allocation while avoiding an investment framework within a liability context.
- The minimal volatility portfolio assumes an LDI strategy has been adopted as the plan de-risked and invests the surplus in a conservative manner.
- Insurer approach assumes the investment framework as proposed above.
Figure 3: The insurer approach balances growth and preservation objectives
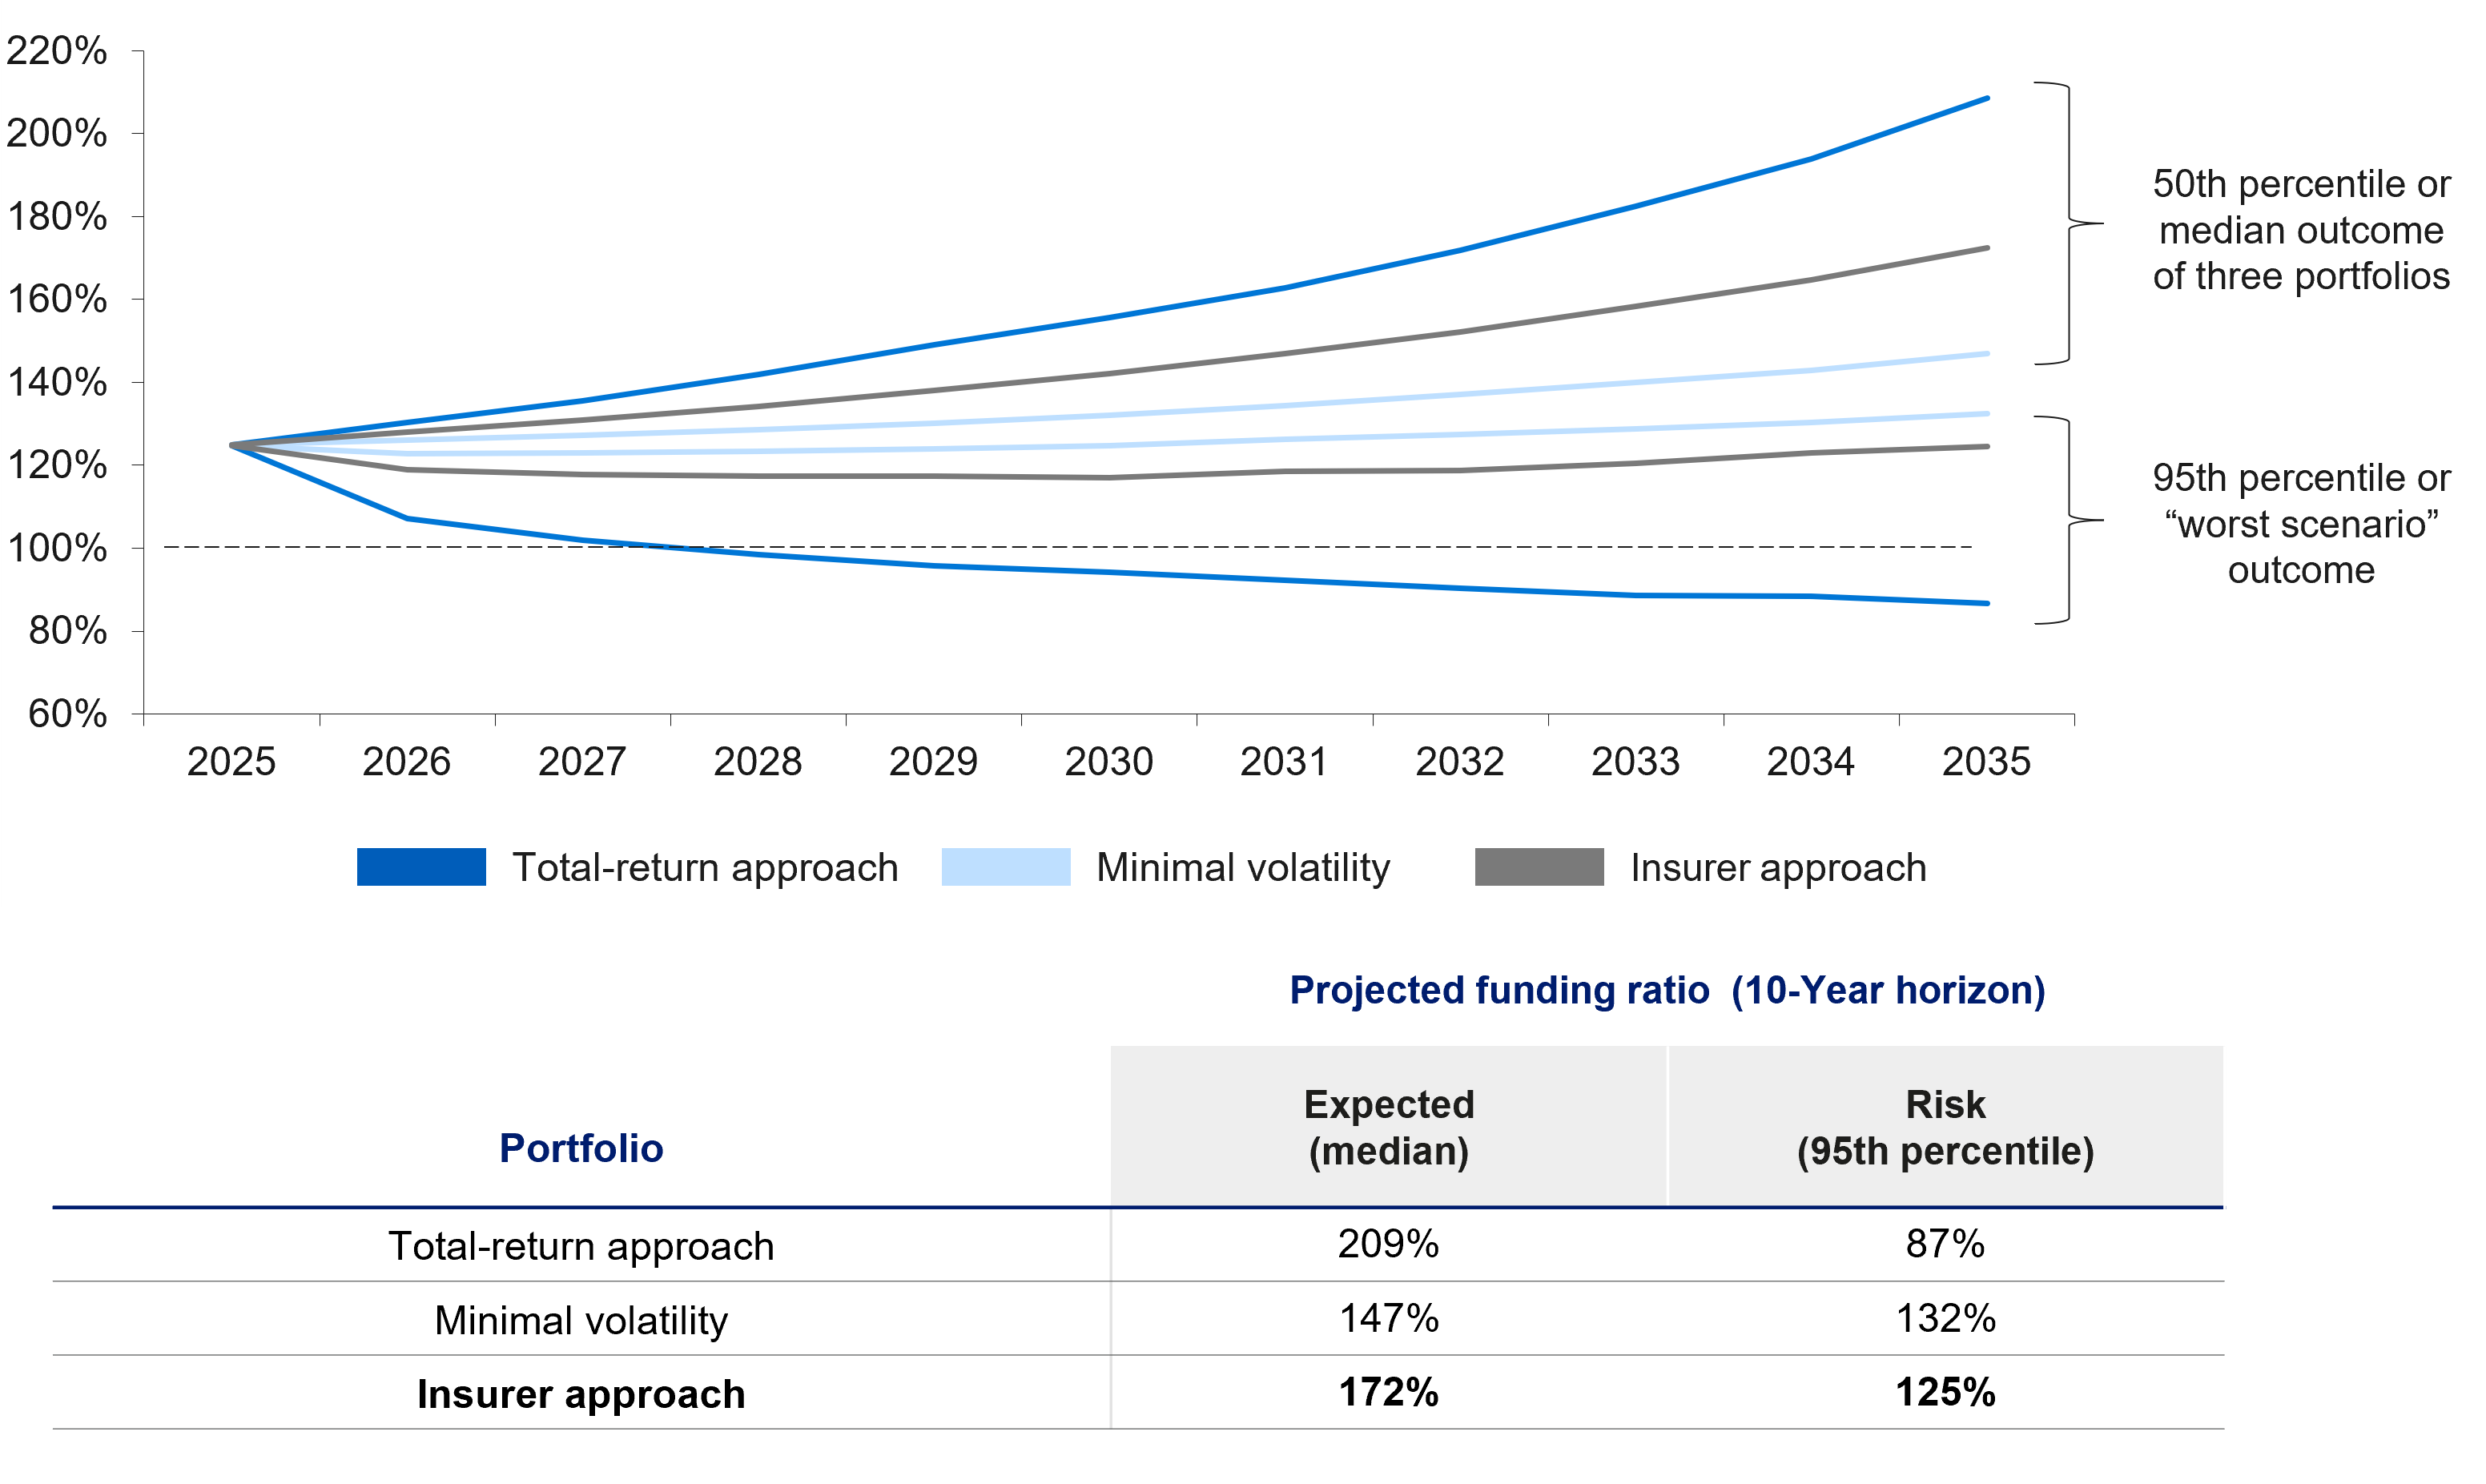
Source: L&G – Asset Management, America. For illustrative purposes only.
As suspected, the total-return approach offers the greatest opportunity for return; however, the “worst-case scenario” results in a funding level that dips below 100%, reaching 87% over the period. The minimal volatility portfolio offers the highest floor, but the lowest ceiling, as the LDI portfolio keeps up with the liability and the surplus assets remain conservatively invested. The insurer approach balances the growth and preservation objectives, ensuring a healthy funding level in the 95th percentile scenario while still offering upside potential to growing the plan’s surplus.
The bottom line
Investing like an insurer can potentially help plan sponsors preserve funding levels and grow a surplus, while retaining flexibility to pivot to a PRT down the road. The insurance industry has demonstrated the ability to successfully manage a surplus within a liability-aware context. We believe it would be prudent to adopt principles from the insurance investing framework as the corporate DB landscape enters this new surplus regime.
1. Source: L&G – Asset Management, America.. Data as of June 30, 2025.
2. Source: Mercer's 2025 CFO Survey 2025 CFO Survey Results - Executive Summary.
Disclosures
Legal & General Investment Management America, Inc. (d/b/a L&G – Asset Management, America) (“LGIMA”, “LGIM America”) is a registered investment adviser with the U.S. Securities and Exchange Commission (“SEC”). LGIMA provides investment advisory services to U.S. clients. L&G’s asset management division more broadly—and the non-LGIMA affiliates that comprise it—are not registered as investment advisers with the SEC and do not independently provide investment advice to U.S. clients. Registration with the SEC does not imply any level of skill or training.
The material in this presentation regarding L&G – Asset Management, America is confidential, intended solely for the person to whom it has been delivered and may not be reproduced or distributed. The material provided is for informational purposes only as a one-on-one presentation and is not intended as a solicitation to buy or sell any securities or other financial instruments or to provide any investment advice or service. Where applicable, offers or solicitations will be made only by means of the appropriate Fund’s confidential offering documents, including related subscription documents (collectively, the “Offering Materials”) that will be furnished to prospective investors. Before making an investment decision, investors are advised to carefully review the Offering Materials, and to consult with their tax, financial and legal advisors. L&G – Asset Management, America does not guarantee the timeliness, sequence, accuracy or completeness of information included. The information contained in this presentation, including, without limitation, forward looking statements, portfolio construction and parameters, markets and instruments traded, and strategies employed, reflects L&G – Asset Management, America’s views as of the date hereof and may be changed in response to L&G – Asset Management, America’s perception of changing market conditions, or otherwise, without further notice to you. Accordingly, the information herein should not be relied on in making any investment decision, as an investment always carries with it the risk of loss and the vulnerability to changing economic, market or political conditions, including but not limited to changes in interest rates, issuer, credit and inflation risk, foreign exchange rates, securities prices, market indexes, operational or financial conditions of companies or other factors. Past performance should not be taken as an indication or guarantee of future performance and no representation, express or implied, is made regarding future performance or that L&G – Asset Management, America’s investment or risk management process will be successful.
Certain information contained in this document constitutes “forward-looking statements,” which can be identified by the use of forward-looking terminology such as “may,” “will,” “should,” “seek,” “expect,” “anticipate,” “target,” “project,” “estimate,” “intend,” “continue,” “believe,” the negatives thereof, other variations thereon or comparable terminology. Due to various risks and uncertainties, actual events or results or the actual performance of the Fund may differ materially from those reflected or contemplated in such forward-looking statements.
In certain strategies, L&G – Asset Management, America might utilize derivative securities which inherently include a higher risk than other investments strategies. Investors should consider these risks with the understanding that the strategy may not be successful and work in all market conditions.
Reference to an index does not imply that an L&G – Asset Management, America portfolio will achieve returns, volatility or other results similar to the index. You cannot invest directly in an index, therefore, the composition of a benchmark index may not reflect the manner in which an L&G – Asset Management, America portfolio is constructed in relation to expected or achieved returns, investment holdings, portfolio guidelines, restrictions, sectors, correlations, concentrations, volatility, or tracking error targets, all of which are subject to change over time.
No representation or warranty is made to the reasonableness of the assumptions made or that all assumptions used to construct the performance provided have been stated or fully considered.
Hypothetical performance results have many inherent limitations and no representation is being made that any account will or is likely to achieve profits or losses similar to those shown. In fact, there are frequently sharp differences between hypothetical performance results and the actual results subsequently achieved by any particular trading program.
One of the limitations of hypothetical performance results is that they are generally prepared with the benefit of hindsight. In addition, hypothetical trading does not involve financial risk, and no hypothetical trading record can completely account for the impact of financial risk in actual trading. For example, the ability to withstand losses or to adhere to a particular trading program in spite of trading losses are material points which can also adversely affect actual trading results. There are numerous other factors related to the markets in general or to the implementation of any specific trading program which cannot be fully accounted for in the preparation of hypothetical performance results and all of which can adversely affect actual trading results.
The use of hypothetical performance is subject to inherent limitations derived from the reliance on historical data and the benefit of hindsight. All trading strategies applied to the analysis were available throughout the performance period. However, the analysis includes certain assumptions where actual performance could be different from the hypothetical performance presented.
The information presented may include assumptions based on hypothetical scenarios. These assumptions are used to illustrate how certain investment strategies, models, or projections might perform under specific conditions.
These assumptions are theoretical and intended to provide a conceptual framework for understanding how certain investment strategies or models might operate under idealized conditions. These assumptions do not reflect actual market conditions or specific investor circumstances. Hypothetical scenarios may simplify complex market dynamics and investor behaviors. They may not fully capture the impact of variables such as market volatility, liquidity constraints, or transaction costs. The assumptions used may have inherent limitations and may not accurately represent future market conditions or investor experiences. They are designed for illustrative purposes only and should not be interpreted as predictive of actual performance or outcomes.
There is no guarantee that actual results will match the outcomes suggested by these hypothetical assumptions. Real-world investing involves risks and uncertainties that may differ from the assumptions made in these scenarios. Investors should carefully consider their own financial situation, risk tolerance, and investment goals before making decisions based on hypothetical assumptions. It is recommended to consult with a financial advisor to understand how these assumptions might apply to actual investment scenarios.
Certain information contained in these materials has been obtained from published and non-published sources prepared by third parties, which, in certain cases, have not been updated through the date hereof. While such information is believed to be reliable, L&G – Asset Management, America has not independently verified such information, nor does it assume any responsibility for the accuracy or completeness of such information. Except as otherwise indicated herein, the information, opinions and estimates provided in this presentation are based on matters and information as they exist as of the date these materials have been prepared and not as of any future date and will not be updated or otherwise revised to reflect information that is subsequently discovered or available, or for changes in circumstances occurring after the date hereof. L&G – Asset Management, America’s opinions and estimates constitute L&G – Asset Management, America’s judgment and should be regarded as indicative, preliminary and for illustrative purposes only.
Portfolio credit quality is calculated using a market value weighted average, based on the conservative average of Moody’s, S&P, and Fitch ratings expressed in Moody’s nomenclature. If all three ratings agencies rate the security, it is the middle of the three, if two, the lower of two, and if one, that becomes the rating.
Unless otherwise stated, references herein to "L&G", "we" and "us" are meant to capture the global conglomerate that includes Legal & General Investment Management Ltd. (a U.K. FCA authorized adviser), Legal & General Investment Management America, Inc. (a U.S. SEC registered investment adviser) Legal & General Investment Management Asia Limited (a Hong Kong SFC registered adviser) , Legal & General Investment Management Japan KK (licensed by the FAS in Japan), and LGIM Singapore Pte. Ltd. (licensed by the MAS in Singapore).
We have more blogs to share
Visit our blog site to explore our latest views on markets, investment strategy and long-term themes.