
Emerging market debt: The case for a strategic allocation

Emerging market debt (EMD) is a large and growing asset class, but generally many investors’ allocations to the asset class do not reflect the potential opportunity. The EMD investable universe rose to $32.5 trillion in 2025, roughly doubling from a decade ago and surpassing that of US Treasuries.1 Yet despite EMD’s size and diversity, we believe the asset class remains underrepresented in global portfolios—and we see key reasons why it may deserve to be considered for a strategic asset allocation.
A growing share of the global economy
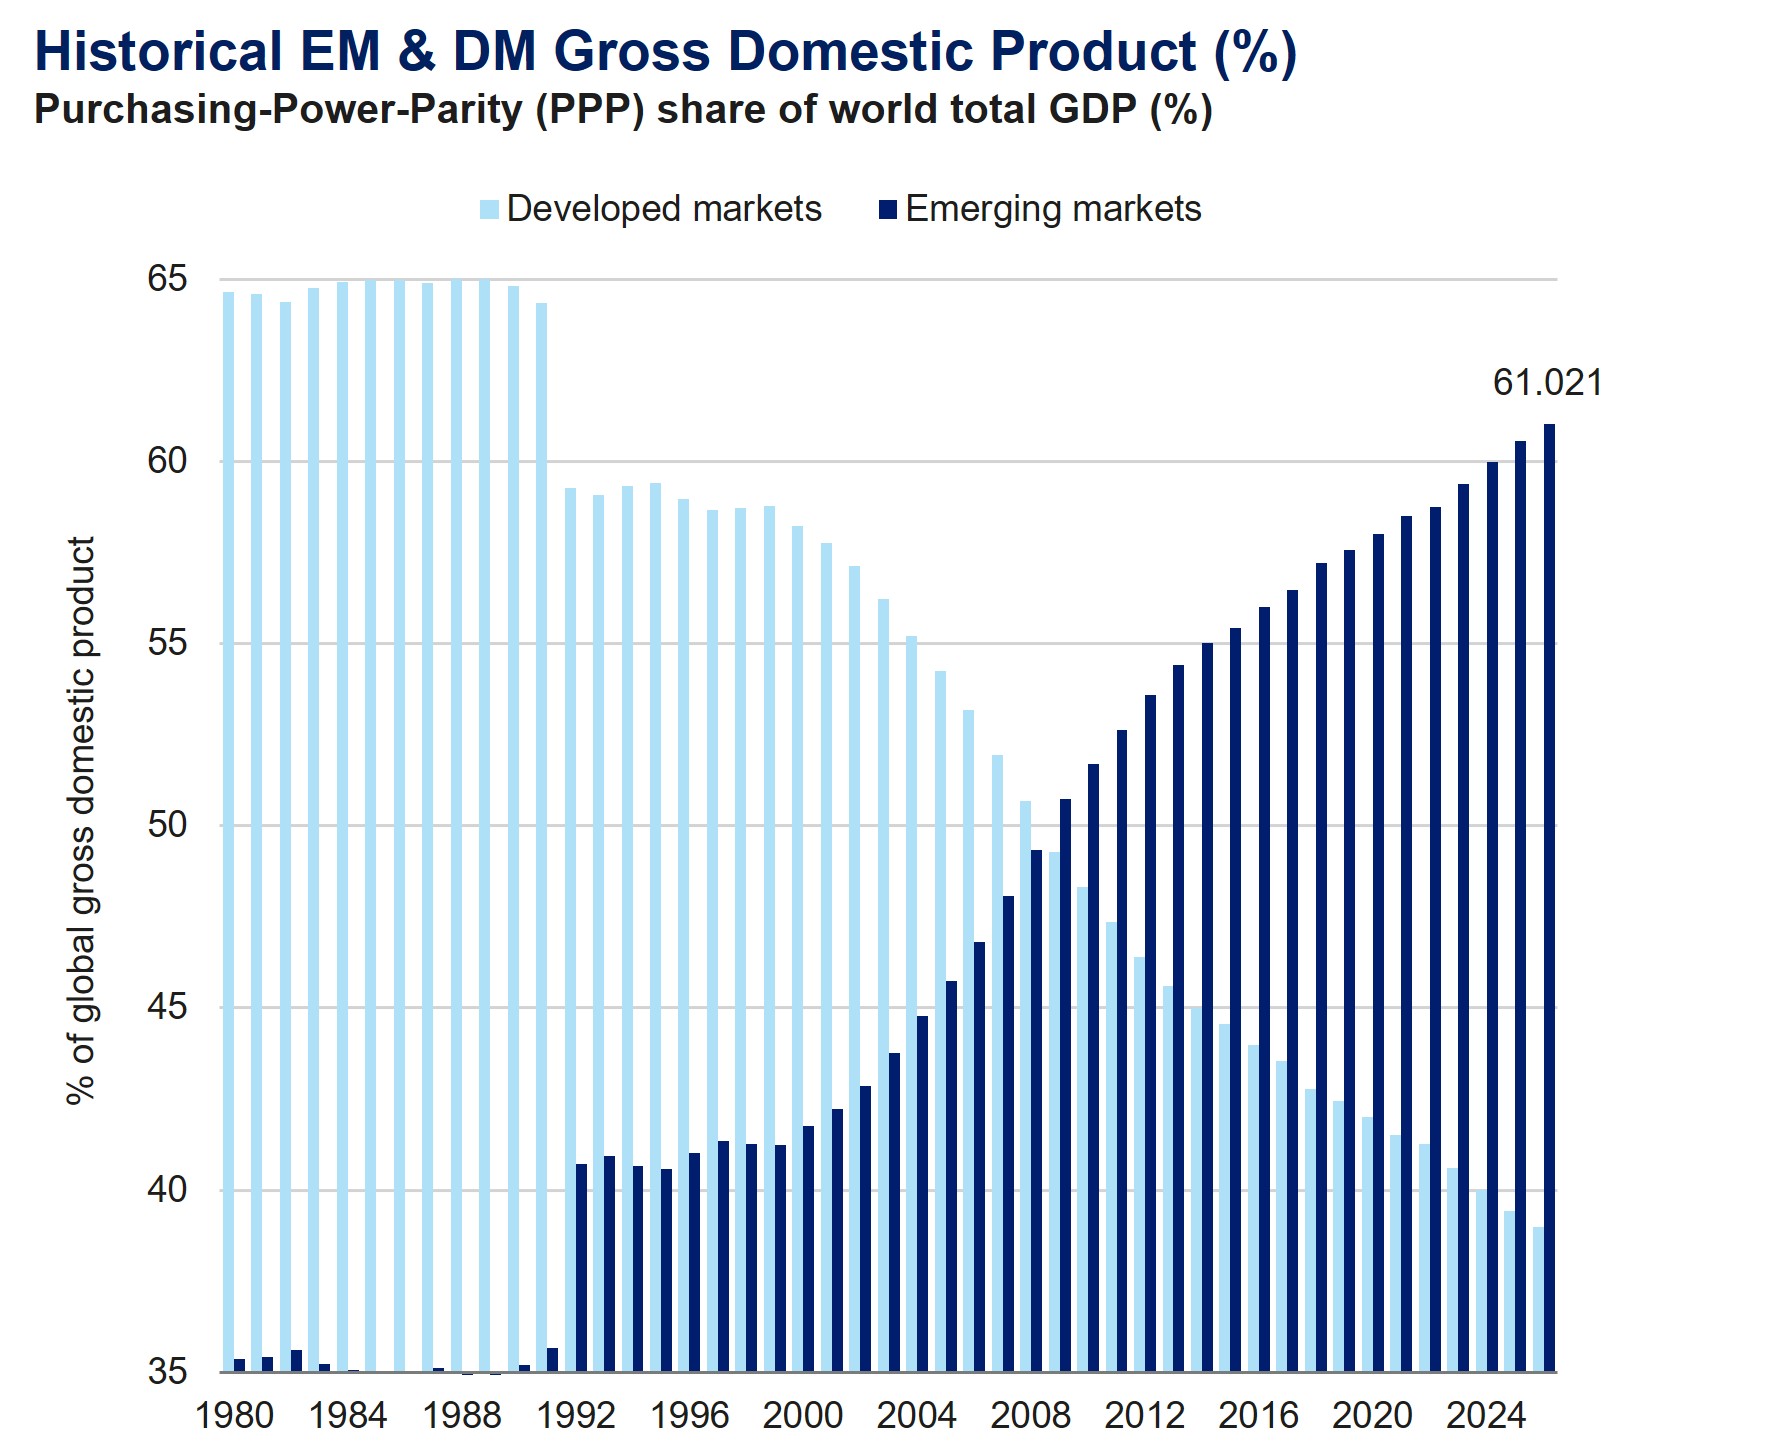
Emerging markets today account for roughly 60% of global gross domestic product (GDP) on a purchasing-power-parity basis, the highest level in recent history for EM share of the global economy. 2 Emerging markets are also increasingly a global growth driver. The IMF forecasts that emerging markets will grow 3.9% in 2026 and 4.2% in 2027, compared with 1.8% and 1.7% for advanced economies.2 Faster growth does not automatically translate into stronger bond returns, but it provides an important backdrop for assessing borrowers’ capacity to service debt. The growth differential also challenges the idea that developed markets should be the default destination for global capital.
Figure 1: Emerging markets dominate the global economy
Source: IMF World Economic Outlook April 30, 2026, Contributors to growth from IMF World Economic Outlook April 2026 Database.
Relatively healthy fundamentals
The case for EMD extends beyond better relative GDP growth. Emerging markets today benefit from substantial foreign exchange reserves, strong access to capital markets and multilateral support. Excluding China, emerging market government debt has remained relatively stable since 2020 and below advanced-economy levels.3 Default expectations are also low, with no sovereign defaults in emerging markets since the end of 2023 and low corporate defaults.4
Ratings momentum provides another encouraging signal, with ratings upgrades outpacing downgrades for the last three years. 5 These aggregate trends do not remove country-specific vulnerabilities, but they support a more differentiated assessment of EM credit risk than the asset class’s reputation sometimes suggests.
Diversification across a substantial market
The $32.5 trillion investable EMD universe provides a broad and generally liquid opportunity set that spans hard-currency and local-currency debt across sovereign and corporate borrowers. Within this substantial market, different economies and policy cycles have the potential to create scope to help diversify exposures and potentially identify where to take risks. Yet implementation matters: Hard-currency debt and local-currency bonds bring different combinations of interest-rate, credit, and currency exposure—key factors to consider when determining EMD allocations within a portfolio.
Supportive technicals
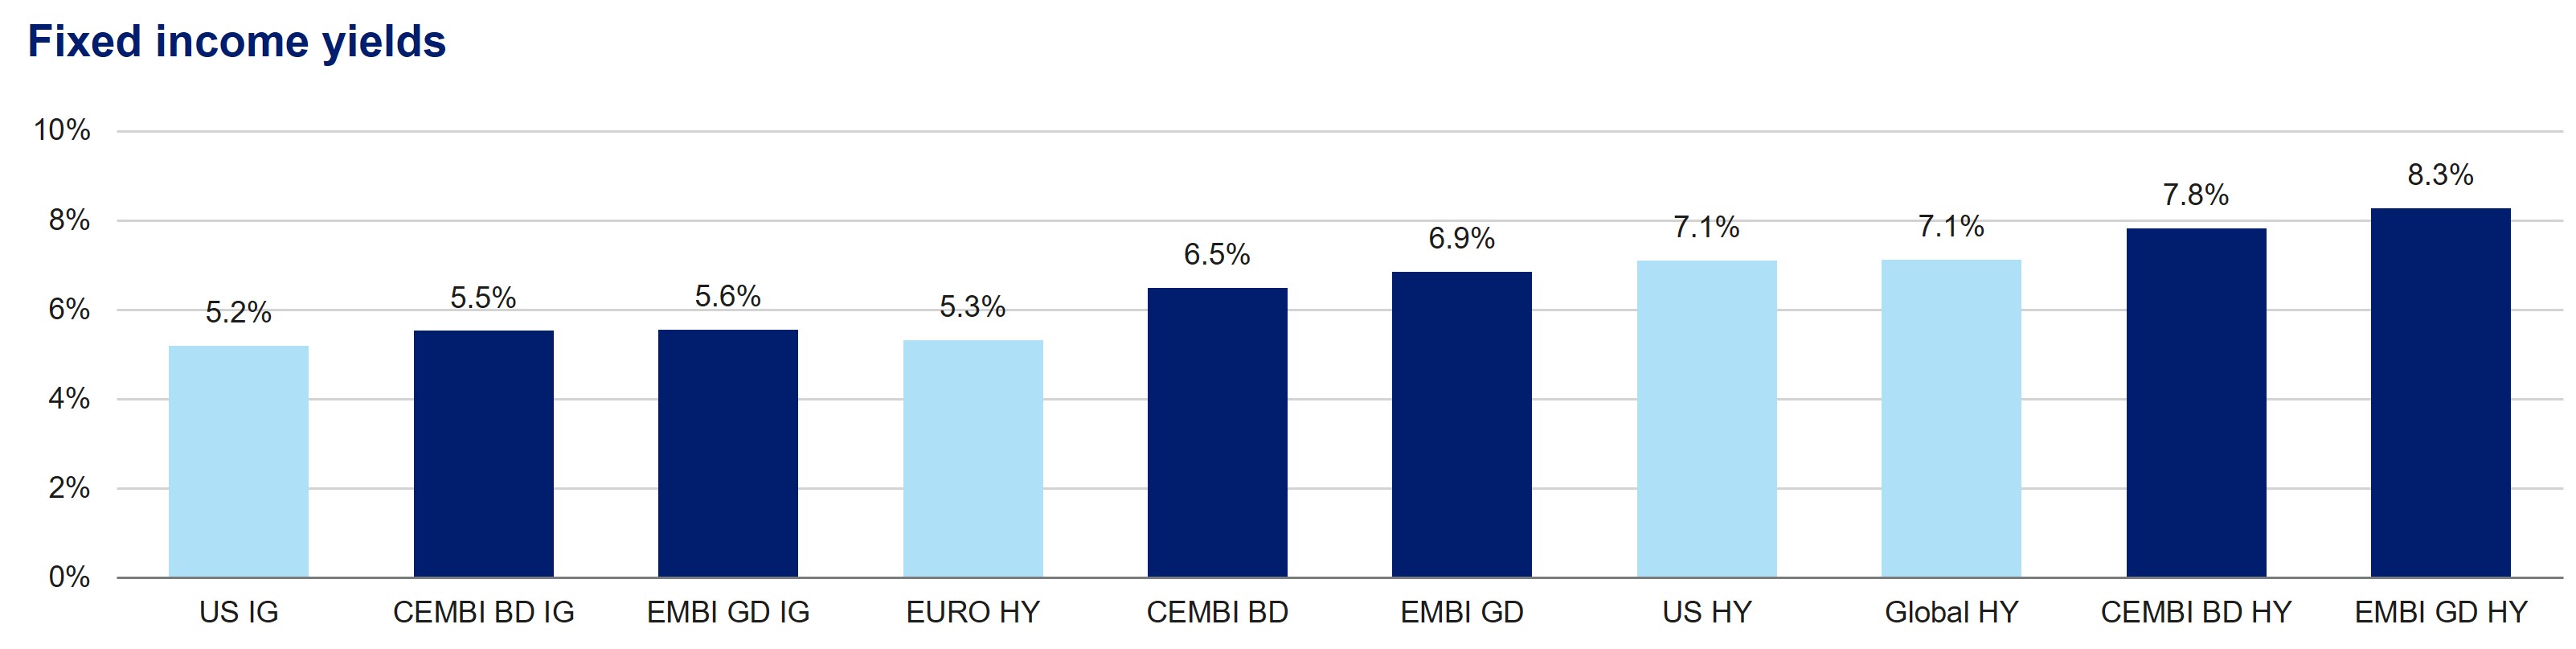
We find that EMD all-in-yields are attractive vs. other similarly rated developed market debt.6 These elevated all-in-yields appear to be driving inflows into the asset class at the same time that 2026 issuance has been front-loaded, strengthening the near-term supply-and-demand backdrop. Yet positioning still has room to grow, in our view.
Figure 2: All-in yields remain elevated
Source: Bloomberg, JPM, as of June 19, 2026. Yields as of June 19, 2026. Indices referenced-US IG –Bloomberg US Corporate Index, CEMBI BD IG –JPM EMD Corporates IG index, EMBI GD IG –JPM EMD Sovereigns IG index, Euro HY –ICE HE00 Index, CEMBI BD –JPM EMD Corporates Index, EMBI GD –JPM Sovereigns Index, US HY –BAML H0A0 Index, Global HY –BAML HWUS Index, CEMBIBD HY –JPM EMD Corporates HY Index, EMBI GD HY –JPM EMD Sovereigns HY Index.
To be sure, geopolitical risks persist as do uncertainties around the outlook for oil, AI capex, US monetary policy and the US dollar. The current El Niño weather cycle also poses inflation and growth risks. Yet these risks and uncertainties appear to be largely global rather than specific to emerging markets, and emerging market spreads so far have remained relatively resilient. Tight spreads do warrant discipline, but we believe that they do not, on their own, undermine the allocation case, given that they are not just a feature of EMD.
Credit selection remains essential
For long-term investors, we believe the combination of economic scale, resilient fundamentals and diversification and income potential makes a strong case a strategic allocation to EMD, sized to an investor’s objectives and risk tolerance, with careful attention to valuation and issuer quality.
Notes
-
Source: J.P. Morgan, BAML, DMO, St. Louis Fed as of December 31, 2025.
-
Source: IMF World Economic Outlook April 30, 2026, Contributors to growth from IMF World Economic Outlook April 2026 Database.
-
Source: LHS – IMF World Economic Outlook Database April 30, 2026, RHS – Bloomberg as of May 31, 2026.
-
Source: L&G.
-
Source: BofA Global Research, as of June 30, 2026, Ratings outlook as of June 4, 2026. 6-month rolling average 2020-2026 year-to-date (not including outlook changes) - BofA Global Research, Bloomberg Note: Suriname, Belize, Ecuador and Argentina were upgraded after restructurings of debt.
-
Bloomberg, JPM, as of June 19, 2026. Yields as of June 19, 2026.
Disclosures
Unless otherwise stated, references herein to "L&G" and “L&G – Asset Management” refer to the global asset management business of Legal & General Group plc. that includes Legal & General Investment Management Ltd. (a U.K. FCA authorized adviser), Legal & General Investment Management America, Inc. (a U.S. SEC registered investment adviser) Legal & General Investment Management Asia Limited (a Hong Kong SFC registered adviser), Legal & General Investment Management Japan KK (licensed by the FAS in Japan), and LGIM Singapore Pte. Ltd. (licensed by the MAS in Singapore). The LGIM Stewardship Team acts on behalf of all such locally authorized entities.
This material is intended to provide only general educational information and market commentary. Views and opinions expressed herein are as of the date set forth above and may change based on market and other conditions. The material may not be reproduced or distributed. The material is for informational purposes only and is not intended as a solicitation to buy or sell any securities or other financial instrument or to provide any investment advice or service. L&G – Asset Management, America does not guarantee the timeliness, sequence, accuracy or completeness of information included. Past performance should not be taken as an indication or guarantee of future performance and no representation, express or implied, is made regarding future performance.
Certain of the information contained herein represents or is based on forward-looking statements or information, including descriptions of anticipated market changes and expectations of future activity. Forward-looking statements and information are inherently uncertain and actual events or results may differ from those projected. Therefore, undue reliance should not be placed on such forward-looking statements and information. There is no guarantee that L&G – Asset Management, America’s investment or risk management processes will be successful.
We have more blogs to share
Visit our blog site to explore our latest views on markets, investment strategy and long-term themes.